Template:T-h weibull: Difference between revisions
| Line 48: | Line 48: | ||
<br> | <br> | ||
::<math>R(T,V,U)={{e}^{-{{\left( \tfrac{T}{A}{{e}^{-\left( \tfrac{\phi }{V}+\tfrac{b}{U} \right)}} \right)}^{\beta }}}}</math> | ::<math>R(T,V,U)={{e}^{-{{\left( \tfrac{T}{A}{{e}^{-\left( \tfrac{\phi }{V}+\tfrac{b}{U} \right)}} \right)}^{\beta }}}}</math> | ||
<br> | |||
====Conditional Reliability Function==== | ====Conditional Reliability Function==== | ||
Revision as of 22:01, 16 February 2012
T-H Weibull
By setting [math]\displaystyle{ \eta =L(U,V) }[/math] in the Weibull [math]\displaystyle{ pdf }[/math], the T--H Weibull model's [math]\displaystyle{ pdf }[/math] is given by:
- [math]\displaystyle{ f(t,\,V,\,U)=\frac{\beta }{A}{{e}^{-\left( \tfrac{\varphi }{V}+\tfrac{b}{U} \right)}}{{\left( \frac{t}{A}{{e}^{-\left( \tfrac{\varphi }{V}+\tfrac{b}{U} \right)}} \right)}^{\beta -1}}{{e}^{-{{\left( \tfrac{t}{A}{{e}^{-\left( \tfrac{\varphi }{V}+\tfrac{b}{U} \right)}} \right)}^{\beta }}}} }[/math]
T-H Weibull Statistical Properties Summary
Mean or MTTF
The mean, [math]\displaystyle{ \overline{T} }[/math] (also called [math]\displaystyle{ MTTF }[/math] ), of the T-H Weibull model is given by:
- [math]\displaystyle{ \overline{T}=A{{e}^{\tfrac{\phi }{V}+\tfrac{b}{U}}}\cdot \Gamma \left( \frac{1}{\beta }+1 \right) }[/math]
where [math]\displaystyle{ \Gamma \left( \tfrac{1}{\beta }+1 \right) }[/math] is the gamma function evaluated at the value of [math]\displaystyle{ \left( \tfrac{1}{\beta }+1 \right) }[/math] .
Median
The median, [math]\displaystyle{ \breve{T}, }[/math] of the T-H Weibull model is given by:
- [math]\displaystyle{ \breve{T}=A{{e}^{\tfrac{\phi }{V}+\tfrac{b}{U}}}{{\left( \ln 2 \right)}^{\tfrac{1}{\beta }}} }[/math]
Mode
The mode, [math]\displaystyle{ \tilde{T}, }[/math] of the T-H Weibull model is given by:
- [math]\displaystyle{ \tilde{T}=A{{e}^{\tfrac{\phi }{V}+\tfrac{b}{U}}}{{\left( 1-\frac{1}{\beta } \right)}^{\tfrac{1}{\beta }}} }[/math]
Standard Deviation
The standard deviation, [math]\displaystyle{ {{\sigma }_{T}}, }[/math] of the T-H Weibull model is given by:
- [math]\displaystyle{ {{\sigma }_{T}}=A{{e}^{\tfrac{\phi }{V}+\tfrac{b}{U}}}\cdot \sqrt{\Gamma \left( \frac{2}{\beta }+1 \right)-{{\left( \Gamma \left( \frac{1}{\beta }+1 \right) \right)}^{2}}} }[/math]
T-H Weibull Reliability Function
The T-H Weibull reliability function is given by:
- [math]\displaystyle{ R(T,V,U)={{e}^{-{{\left( \tfrac{T}{A}{{e}^{-\left( \tfrac{\phi }{V}+\tfrac{b}{U} \right)}} \right)}^{\beta }}}} }[/math]
Conditional Reliability Function
The T-H Weibull conditional reliability function at a specified stress level is given by:
- [math]\displaystyle{ R(T,t,V,U)=\frac{R(T+t,V,U)}{R(T,V,U)}=\frac{{{e}^{-{{\left( \tfrac{T+t}{A}{{e}^{-\left( \tfrac{\phi }{V}+\tfrac{b}{U} \right)}} \right)}^{\beta }}}}}{{{e}^{-{{\left( \tfrac{T}{A}{{e}^{-\left( \tfrac{\phi }{V}+\tfrac{b}{U} \right)}} \right)}^{\beta }}}}} }[/math]
or:
- [math]\displaystyle{ R(T,t,V,U)={{e}^{-\left[ {{\left( \tfrac{T+t}{A}{{e}^{-\left( \tfrac{\phi }{V}+\tfrac{b}{U} \right)}} \right)}^{\beta }}-{{\left( \tfrac{T}{A}{{e}^{-\left( \tfrac{\phi }{V}+\tfrac{b}{U} \right)}} \right)}^{\beta }} \right]}} }[/math]
Reliable Life
For the T-H Weibull model, the reliable life, [math]\displaystyle{ {{t}_{R}} }[/math] , of a unit for a specified reliability and starting the mission at age zero is given by:
- [math]\displaystyle{ {{t}_{R}}=A{{e}^{\tfrac{\phi }{V}+\tfrac{b}{U}}}{{\left\{ -\ln \left[ R\left( {{T}_{R}},V,U \right) \right] \right\}}^{\tfrac{1}{\beta }}} }[/math]
T-H Weibull Failure Rate Function
The T-H Weibull failure rate function, [math]\displaystyle{ \lambda (T,V,U) }[/math] , is given by:
- [math]\displaystyle{ \lambda \left( T,V,U \right)=\frac{f\left( T,V,U \right)}{R\left( T,V,U \right)}=\frac{\beta }{A}{{e}^{-\left( \tfrac{\phi }{V}+\tfrac{b}{U} \right)}}{{\left( \frac{T}{A}{{e}^{-\left( \tfrac{\phi }{V}+\tfrac{b}{U} \right)}} \right)}^{\beta -1}} }[/math]
Parameter Estimation
Maximum Likelihood Estimation Method
Substituting the T-H model into the Weibull log-likelihood function yields:
- [math]\displaystyle{ \begin{align} & \ln (L)= & \Lambda =\underset{i=1}{\overset{{{F}_{e}}}{\mathop \sum }}\,{{N}_{i}}\ln \left[ \frac{\beta }{A}{{e}^{-\left( \tfrac{\phi }{{{V}_{i}}}+\tfrac{b}{{{U}_{i}}} \right)}}{{\left( \frac{{{T}_{i}}}{A}{{e}^{-\left( \tfrac{\phi }{{{V}_{i}}}+\tfrac{b}{{{U}_{i}}} \right)}} \right)}^{\beta -1}}{{e}^{-{{\left( \tfrac{{{T}_{i}}}{A}{{e}^{-\left( \tfrac{\phi }{{{V}_{i}}}+\tfrac{b}{{{U}_{i}}} \right)}} \right)}^{\beta }}}} \right] \\ & & -\underset{i=1}{\overset{S}{\mathop \sum }}\,N_{i}^{\prime }{{\left( \frac{T_{i}^{\prime }}{A}{{e}^{-\left( \tfrac{\phi }{{{V}_{i}}}+\tfrac{b}{{{U}_{i}}} \right)}} \right)}^{\beta }}+\overset{FI}{\mathop{\underset{i=1}{\mathop{\underset{}{\overset{}{\mathop \sum }}\,}}\,}}\,N_{i}^{\prime \prime }\ln [R_{Li}^{\prime \prime }-R_{Ri}^{\prime \prime }] \end{align} }[/math]
where:
- [math]\displaystyle{ R_{Li}^{\prime \prime }={{e}^{-{{\left( \tfrac{T_{Li}^{\prime \prime }}{A}{{e}^{-\left( \tfrac{\phi }{{{V}_{i}}}+\tfrac{b}{U_{i}^{\prime \prime }} \right)}} \right)}^{\beta }}}} }[/math]
- [math]\displaystyle{ R_{Ri}^{\prime \prime }={{e}^{-{{\left( \tfrac{T_{Ri}^{\prime \prime }}{A}{{e}^{-\left( \tfrac{\phi }{{{V}_{i}}}+\tfrac{b}{U_{i}^{\prime \prime }} \right)}} \right)}^{\beta }}}} }[/math]
and:
• [math]\displaystyle{ {{F}_{e}} }[/math] is the number of groups of exact times-to-failure data points.
• [math]\displaystyle{ {{N}_{i}} }[/math] is the number of times-to-failure data points in the [math]\displaystyle{ {{i}^{th}} }[/math] time-to-failure data group.
• [math]\displaystyle{ \beta }[/math] is the Weibull shape parameter (unknown, the first of four parameters to be estimated).
• .. is the T-H parameter (unknown, the second of four parameters to be estimated).
• [math]\displaystyle{ \phi }[/math] is the second T-H parameter (unknown, the third of four parameters to be estimated).
• [math]\displaystyle{ b }[/math] is the third T-H parameter (unknown, the fourth of four parameters to be estimated).
• [math]\displaystyle{ {{V}_{i}} }[/math] is the temperature level of the [math]\displaystyle{ {{i}^{th}} }[/math] group.
• [math]\displaystyle{ {{U}_{i}} }[/math] is the relative humidity level of the [math]\displaystyle{ {{i}^{th}} }[/math] group.
• [math]\displaystyle{ {{T}_{i}} }[/math] is the exact failure time of the [math]\displaystyle{ {{i}^{th}} }[/math] group.
• [math]\displaystyle{ S }[/math] is the number of groups of suspension data points.
• [math]\displaystyle{ N_{i}^{\prime } }[/math] is the number of suspensions in the [math]\displaystyle{ {{i}^{th}} }[/math] group of suspension data points.
• [math]\displaystyle{ T_{i}^{\prime } }[/math] is the running time of the [math]\displaystyle{ {{i}^{th}} }[/math] suspension data group.
• [math]\displaystyle{ FI }[/math] is the number of interval data groups.
• [math]\displaystyle{ N_{i}^{\prime \prime } }[/math] is the number of intervals in the [math]\displaystyle{ {{i}^{th}} }[/math] group of data intervals.
• [math]\displaystyle{ T_{Li}^{\prime \prime } }[/math] is the beginning of the interval.
• [math]\displaystyle{ T_{Ri}^{\prime \prime } }[/math] is the ending of the [math]\displaystyle{ {{i}^{th}} }[/math] interval.
The solution (parameter estimates) will be found by solving for the parameters [math]\displaystyle{ A, }[/math] [math]\displaystyle{ \phi , }[/math] [math]\displaystyle{ b }[/math] and [math]\displaystyle{ \beta }[/math] so that [math]\displaystyle{ \tfrac{\partial \Lambda }{\partial \beta }=0, }[/math] [math]\displaystyle{ \tfrac{\partial \Lambda }{\partial A}=0, }[/math] [math]\displaystyle{ \tfrac{\partial \Lambda }{\partial \phi }=0 }[/math] and [math]\displaystyle{ \tfrac{\partial \Lambda }{\partial b}=0 }[/math] .
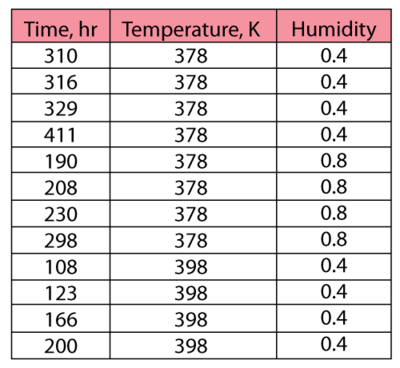
The following data were collected after testing twelve electronic devices at different temperature and humidity conditions:
Using ALTA, the following results were obtained:
- [math]\displaystyle{ \begin{align} \widehat{\beta }=\ & 5.874395 \\ & & \\ \widehat{A}=\ & 0.000060 \\ & & \\ \widehat{b}=\ & 0.280599 \\ & & \\ \widehat{\phi}=\ & 5630.329851 \end{align}\,\! }[/math]
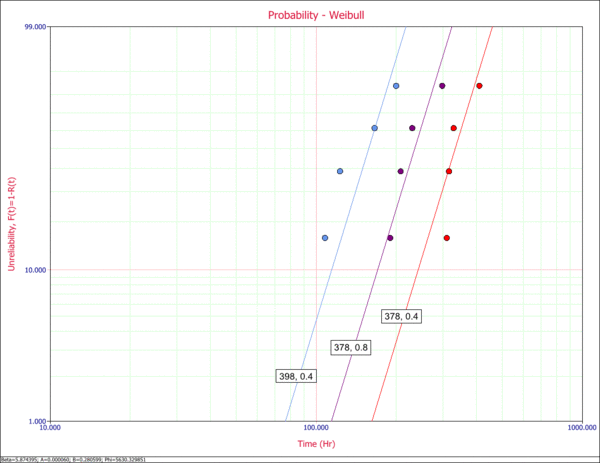
A probability plot for the entered data is shown next.
Note that three lines are plotted because there are three combinations of stresses, namely, (398K, 0.4), (378K, 0.8) and (378K, 0.4).
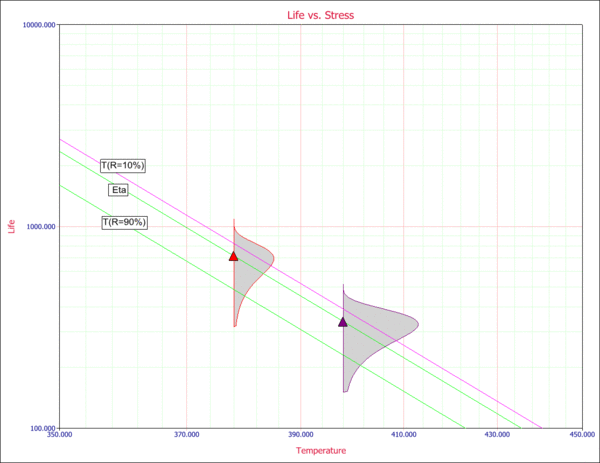
Given the use stress levels, time estimates can be obtained for a specified probability. A Life vs. Stress plot can be obtained if one of the stresses is kept constant. For example, the following picture shows a Life vs. Temperature plot at a constant humidity of 0.4.


