BlockSim Phase Simulation Plot Examples: Difference between revisions
Lisa Hacker (talk | contribs) No edit summary |
Lisa Hacker (talk | contribs) No edit summary |
||
| Line 1: | Line 1: | ||
{{Banner BlockSim Examples}} | {{Banner BlockSim Examples}}{{Navigation box}} | ||
====Oil Refinery System ==== | ====Oil Refinery System ==== | ||
Consider a simplified reliability block diagram (RBD) of an oil refinery, as shown next. The RBD consists of a block representing the crude oil supply (Crude Oil Supply block) and two pumps (Pump 1 and Pump 2 blocks) used to feed the crude oil to the furnace (Furnace block). The crude oil from the furnace is sent to the fractional distillation column (Distillation Unit block) to separate out different fractions. For simplicity it is assumed that gasoline is the only main fraction under consideration. Some gasoline is also obtained from cracking of higher fractions (Cracking Unit block). All units processing gasoline after the fractional distillation and cracking are represented by a single block (Gasoline Unit block). Gasoline and the other fractions (Other Fractions block), after going through their respective refining processes, are sent for storage. Storage units for the whole refinery are again represented by a single block (Storage block). | Consider a simplified reliability block diagram (RBD) of an oil refinery, as shown next. The RBD consists of a block representing the crude oil supply (Crude Oil Supply block) and two pumps (Pump 1 and Pump 2 blocks) used to feed the crude oil to the furnace (Furnace block). The crude oil from the furnace is sent to the fractional distillation column (Distillation Unit block) to separate out different fractions. For simplicity it is assumed that gasoline is the only main fraction under consideration. Some gasoline is also obtained from cracking of higher fractions (Cracking Unit block). All units processing gasoline after the fractional distillation and cracking are represented by a single block (Gasoline Unit block). Gasoline and the other fractions (Other Fractions block), after going through their respective refining processes, are sent for storage. Storage units for the whole refinery are again represented by a single block (Storage block). | ||
Latest revision as of 10:06, 9 August 2012
 |
New format available! This reference is now available in a new format that offers faster page load, improved display for calculations and images and more targeted search.
As of January 2024, this Reliawiki page will not continue to be updated. Please update all links and bookmarks to the latest references at BlockSim examples and BlockSim reference examples.
Oil Refinery System
Consider a simplified reliability block diagram (RBD) of an oil refinery, as shown next. The RBD consists of a block representing the crude oil supply (Crude Oil Supply block) and two pumps (Pump 1 and Pump 2 blocks) used to feed the crude oil to the furnace (Furnace block). The crude oil from the furnace is sent to the fractional distillation column (Distillation Unit block) to separate out different fractions. For simplicity it is assumed that gasoline is the only main fraction under consideration. Some gasoline is also obtained from cracking of higher fractions (Cracking Unit block). All units processing gasoline after the fractional distillation and cracking are represented by a single block (Gasoline Unit block). Gasoline and the other fractions (Other Fractions block), after going through their respective refining processes, are sent for storage. Storage units for the whole refinery are again represented by a single block (Storage block).

The purpose of the Crude Oil Supply block in the diagram is to represent the time-varying throughput as the oil refinery goes through its three operational phases of Start Up, Normal Production and Shut Down. This block is therefore not assigned any failure properties and is set to ignore backlog.
The two pump blocks are used to represent two supply lines of crude oil (along with their respective components such as pumps and valves) to the refinery furnace. One of the lines is assumed to supply 70% of crude oil while the other line supplies the remaining 30%. This is achieved by selecting the Weighted allocation across paths option for the throughput simulation settings for the Crude Oil Supply block and assigning throughput values of 70 and 30 units per day respectively for the Pump 1 and Pump 2 blocks.
It is assumed that gasoline is obtained as 45% of the crude oil supply. Thus a throughput of 45 units per day is assigned to the Gasoline Unit block. The remaining 55% throughput is assigned to the Other Fractions block. The unequal division of throughput across the two paths is achieved using the Weighted allocation across paths option for the Cracking Unit block. Both the Gasoline Unit block and the Other Fractions block are required to remain operational for the refinery to function. Thus a 2-out-of-2 node is used to represent this series configuration.
The Storage block is assumed to have no failure or repair properties.
Phases and Throughput
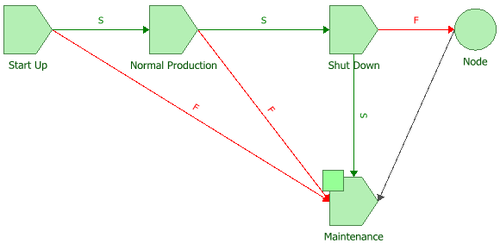
The phase diagram is shown next.
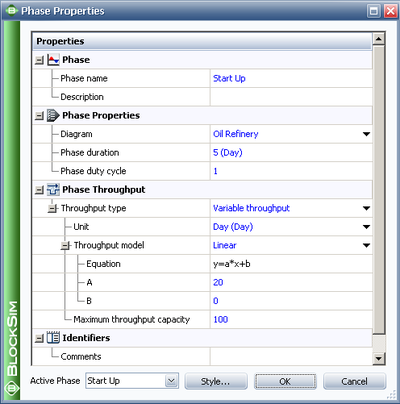
During the Start Up phase, the crude oil supply is assumed to increase linearly with time from 0% to 100% (full production capacity of the refinery). A 5-day start-up period is assumed for the refinery to reach its full production. A linear throughput model, y=20x, is therefore used to represent the increase in throughput from 1 item processed per day on the first day to 100 items processed per day on the last day (5th day) of the Start Up phase, as shown next.
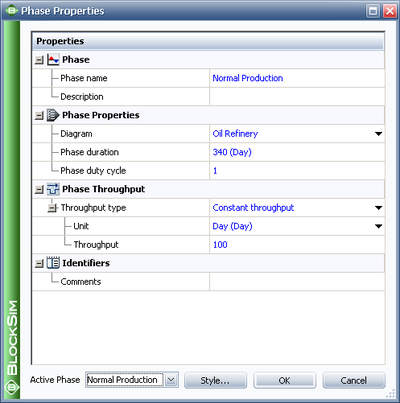
After start up, the oil refinery begins receiving the full capacity supply of crude oil, represented as a constant throughput of 100 items processed per day for the Normal Production phase. This phase is assumed to last for 340 days.
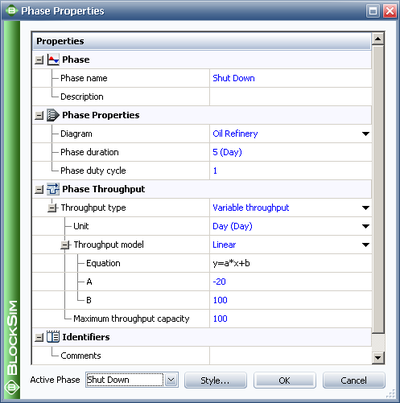
After 340 days of Normal Production the refinery is assumed to go through a Shut Down phase to prepare for a major annual overhaul. During the 5-day duration of the Shut Down phase crude oil supply is gradually decreased from 100% production to 0% production. This is represented by using the linear throughput model y=100-20x for this phase.
The major annual overhaul is represented by a maintenance phase, which is the fourth and last phase of the phase diagram. In this phase, all components are preventively maintained and failed components, if any, are subjected to repairs. Except for the two pump blocks, it is assumed that no blocks can be repaired during the operational phases. Any system failure of the refinery during any of the operational phases is considered to lead to an immediate overhaul of the refinery. Thus the failure path for all the operational phases leads to the Maintenance phase.
Simulation Objective
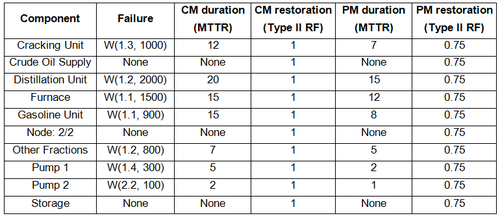
A phase diagram simulation is run to estimate availability and percentage of gasoline throughput obtained from the refinery for a one-year period. (The percentage of gasoline obtained from crude oil over the one-year period may be determined by dividing the total throughput of the Gasoline Unit block to the total throughput of the Crude Oil Supply block. Ideally this percentage should be 45%, but due to failures of the refinery the actual throughput percentage obtained would be less.) The following failure and repair properties (in days) are assumed for the different blocks used in the RBD:
Results and Plots
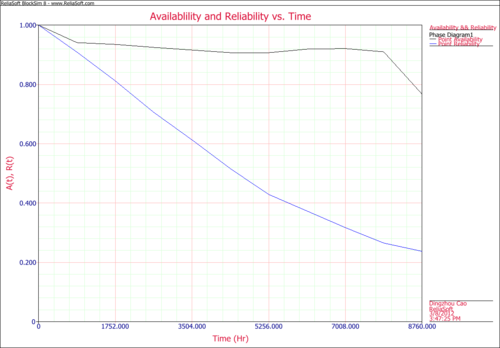
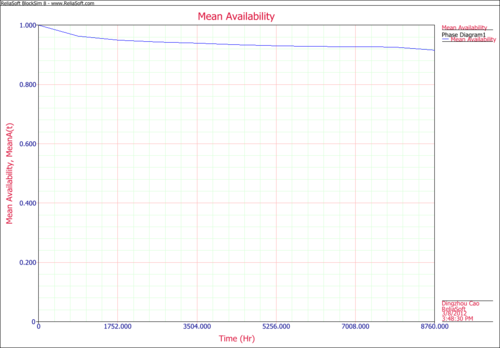
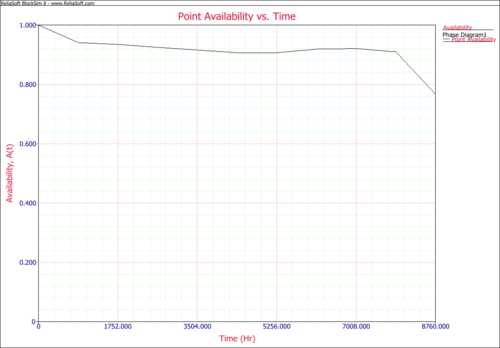
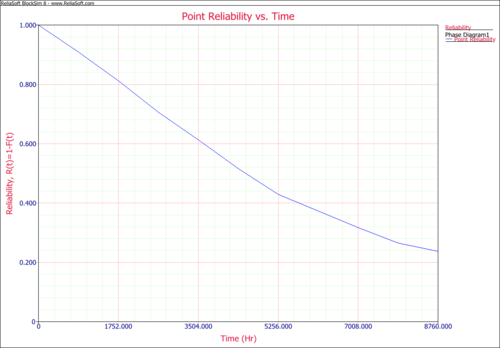
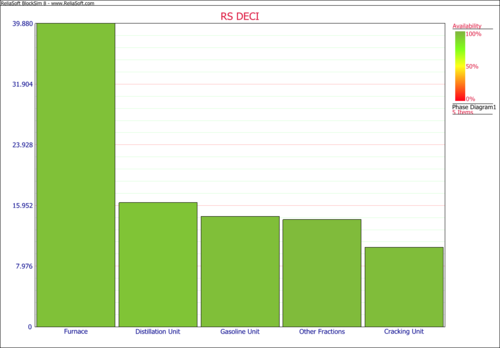
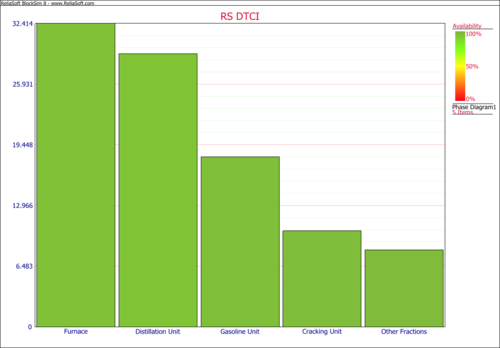
With simulation end time as 365 days (8760 hours) and 1000 simulations, next we will show some plots of the simulation results for this oil refinery example.
Availability and Reliability vs. Time
Mean Availability
Point Availability
Point Reliability
RS DECI
RS DTCI
RS DTCI (Tableau)
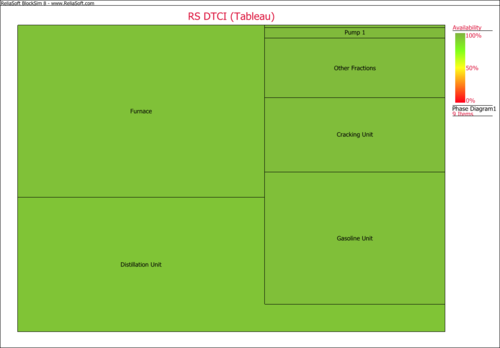
System Availability
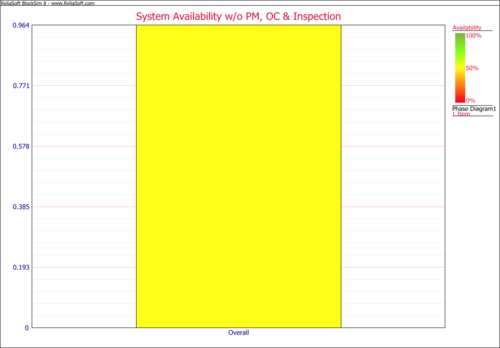
System Availability - All Events
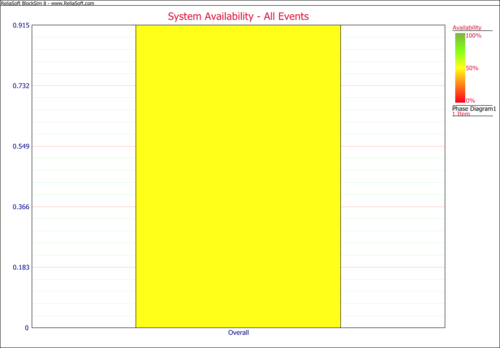
System Downtime
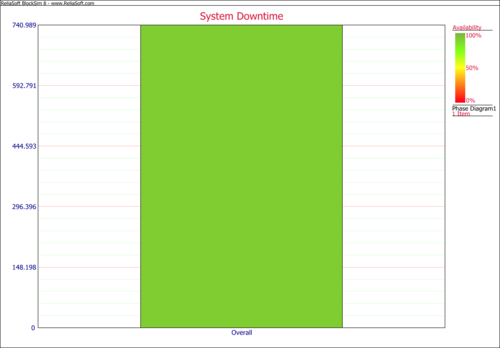
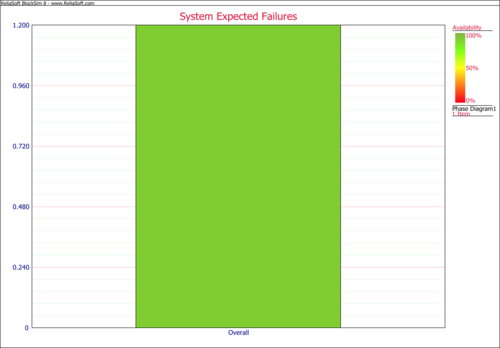
System Expected Failues
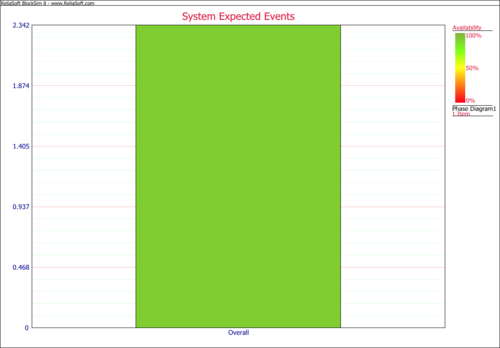
System Expected Downing Events
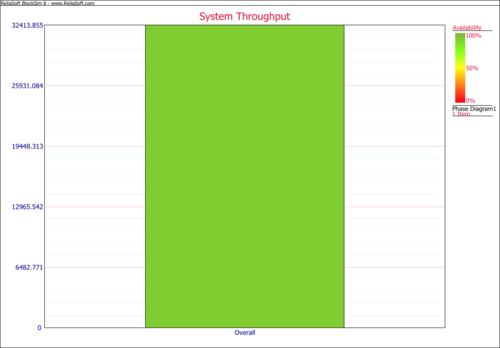
System Throughput
