Sequential Data with Failure Modes - Logistic Model: Difference between revisions
Jump to navigation
Jump to search
Chris Kahn (talk | contribs) No edit summary |
Lisa Hacker (talk | contribs) No edit summary |
||
| (One intermediate revision by one other user not shown) | |||
| Line 1: | Line 1: | ||
<noinclude>{{Banner RGA Examples}} | <noinclude>{{Banner RGA Examples}} | ||
''This example appears in the [ | ''This example appears in the [https://help.reliasoft.com/reference/reliability_growth_and_repairable_system_analysis Reliability growth reference]''. | ||
</noinclude> | </noinclude> | ||
| Line 62: | Line 62: | ||
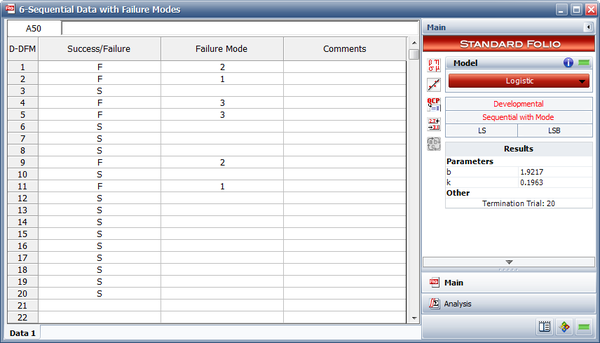
<li>The next figure shows the entered data and the estimated parameters. | <li>The next figure shows the entered data and the estimated parameters. | ||
<br> | <br> | ||
[[Image:rga8.15.png|center| | [[Image:rga8.15.png|center|600px]] | ||
<br></li> | <br></li> | ||
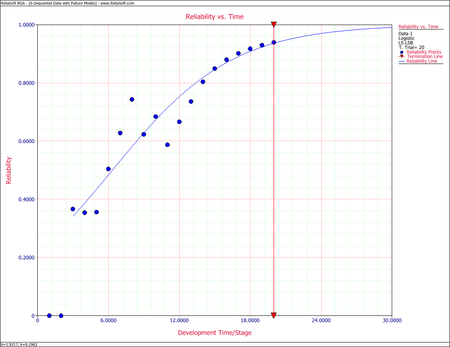
<li>The next figure displays the Reliability vs. Time plot. | <li>The next figure displays the Reliability vs. Time plot. | ||
<br> | <br> | ||
[[Image:rga8.16.png|center| | [[Image:rga8.16.png|center|450px]] | ||
<br></li> | <br></li> | ||
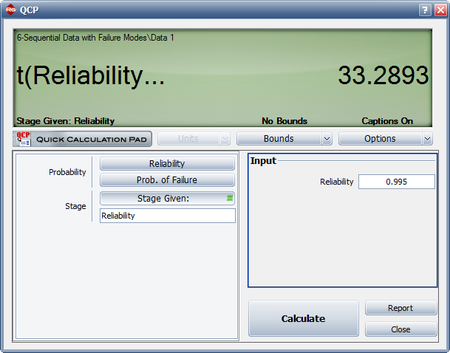
<li>The next figure displays the number of launches before the reliability goal of 99.5% will be achieved. | <li>The next figure displays the number of launches before the reliability goal of 99.5% will be achieved. | ||
<br> | <br> | ||
[[Image:rga8.17.png|center| | [[Image:rga8.17.png|center|450px]] | ||
<br></li> | <br></li> | ||
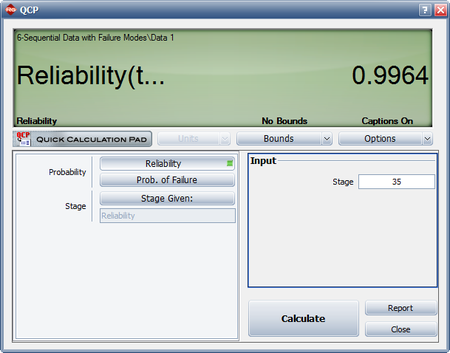
<li>The last figure displays the reliability after the 35th launch. | <li>The last figure displays the reliability after the 35th launch. | ||
<br> | <br> | ||
[[Image:rga8.18.png|center| | [[Image:rga8.18.png|center|450px]] | ||
</li> | </li> | ||
</ol> | </ol> | ||
Latest revision as of 21:22, 18 September 2023
 |
New format available! This reference is now available in a new format that offers faster page load, improved display for calculations and images and more targeted search.
As of January 2024, this Reliawiki page will not continue to be updated. Please update all links and bookmarks to the latest references at RGA examples and RGA reference examples.
This example appears in the Reliability growth reference.
Consider the data given in the Missile Launch Test example. Now suppose that the engineers assigned failure modes to each failure and that the appropriate corrective actions were taken.
The table below presents the data.
- Find the Logistic reliability growth curve that best represents the data.
- Plot it comparatively with the raw data.
- If design changes continue to be incorporated and the testing continues, when will the reliability goal of 99.50% be achieved?
- If design changes continue to be incorporated and the testing continues, what will be the attainable reliability at the end of the 35th launch?
| Launch Number | Result | Mode |
|---|---|---|
| 1 | F | 2 |
| 2 | F | 1 |
| 3 | S | |
| 4 | F | 3 |
| 5 | F | 3 |
| 6 | S | |
| 7 | S | |
| 8 | S | |
| 9 | F | 2 |
| 10 | S | |
| 11 | F | 1 |
| 12 | S | |
| 13 | S | |
| 14 | S | |
| 15 | S | |
| 16 | S | |
| 17 | S | |
| 18 | S | |
| 19 | S | |
| 20 | S |
Solution
- The next figure shows the entered data and the estimated parameters.
- The next figure displays the Reliability vs. Time plot.
- The next figure displays the number of launches before the reliability goal of 99.5% will be achieved.
- The last figure displays the reliability after the 35th launch.