ALTA SimuMatic Example: Difference between revisions
Chris Kahn (talk | contribs) No edit summary |
Lisa Hacker (talk | contribs) No edit summary |
||
| Line 1: | Line 1: | ||
{ | {{Banner ALTA Examples}} | ||
SimuMatic is a simulation tool that can assist in designing accelerated tests. The following example illustrates a potential use of SimuMatic. | SimuMatic is a simulation tool that can assist in designing accelerated tests. The following example illustrates a potential use of SimuMatic. | ||
| Line 11: | Line 7: | ||
[[image: ALTA_SimuMatic_Example_1.gif | [[image: ALTA_SimuMatic_Example_1.gif|center|400px]] | ||
| Line 17: | Line 13: | ||
[[image: ALTA_SimuMatic_Example_2.gif | [[image: ALTA_SimuMatic_Example_2.gif|center|400px]] | ||
| Line 29: | Line 25: | ||
[[image: ALTA_SimuMatic_Example_4.gif | [[image: ALTA_SimuMatic_Example_4.gif|center|400px]] | ||
| Line 35: | Line 31: | ||
[[image: ALTA_SimuMatic_Example_5.gif | [[image: ALTA_SimuMatic_Example_5.gif|center|400px]] | ||
| Line 41: | Line 37: | ||
[[image: ALTA_SimuMatic_Example_6.gif | [[image: ALTA_SimuMatic_Example_6.gif|center|400px]] | ||
| Line 47: | Line 43: | ||
[[image: ALTA_SimuMatic_Example_7.gif | [[image: ALTA_SimuMatic_Example_7.gif|center|400px]] | ||
| Line 53: | Line 49: | ||
[[image: ALTA_SimuMatic_Example_8.gif | [[image: ALTA_SimuMatic_Example_8.gif|center|400px]] | ||
[[image: ALTA_SimuMatic_Example_9.gif | [[image: ALTA_SimuMatic_Example_9.gif|center|400px]] | ||
[[image: ALTA_SimuMatic_Example_10.gif | [[image: ALTA_SimuMatic_Example_10.gif|center|400px]] | ||
| Line 65: | Line 61: | ||
[[image: ALTA_SimuMatic_Example_11.gif | [[image: ALTA_SimuMatic_Example_11.gif|center|400px]] | ||
| Line 71: | Line 67: | ||
[[image: ALTA_SimuMatic_Example_12.gif | [[image: ALTA_SimuMatic_Example_12.gif|center|400px]] | ||
| Line 77: | Line 73: | ||
[[image: ALTA_SimuMatic_Example_13.gif | [[image: ALTA_SimuMatic_Example_13.gif|center|400px]] | ||
| Line 83: | Line 79: | ||
[[image: ALTA_SimuMatic_Example_14.gif | [[image: ALTA_SimuMatic_Example_14.gif|center|400px]] | ||
| Line 89: | Line 85: | ||
[[image: ALTA_SimuMatic_Example_15.gif | [[image: ALTA_SimuMatic_Example_15.gif|center|400px]] | ||
Latest revision as of 07:39, 8 August 2012
 |
New format available! This reference is now available in a new format that offers faster page load, improved display for calculations and images and more targeted search.
As of January 2024, this Reliawiki page will not continue to be updated. Please update all links and bookmarks to the latest references at ALTA examples and ALTA reference examples.
SimuMatic is a simulation tool that can assist in designing accelerated tests. The following example illustrates a potential use of SimuMatic.
A reliability engineer wants to design an accelerated test for an electronic component in order to demonstrate a B10 life of 1 year with a 90% confidence (1-sided limit). The engineer has 3 months available for testing and wants to determine the required sample size in the test using SimuMatic. The accelerated test will be a temperature test at 350K, 375K and 400K with a use temperature of 300K. The Arrhenius model is chosen as the life vs. stress relationship and the Weibull as the failure distribution.
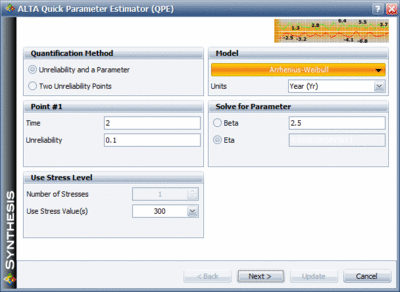
The first thing that needs to be determined in SimuMatic is the parameters of the chosen Arrhenius-Weibull model. Those parameters can be approximated using the Quick Parameter Estimator (QPE) tool in ALTA. Based on historical field information the engineer estimates a beta of 2.5 and a B10 life of 2 years at the use stress of 300K. The next figure shows the QPE with the stated assumptions.
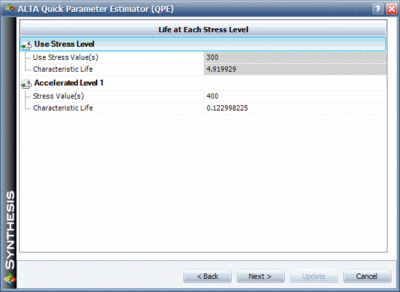
The next required input in the QPE is the characteristic life at a higher stress. From past accelerated tests the engineer expects to achieve an acceleration factor of 40 between the highest stress level and the use stress level. Therefore he sets the characteristic life at 400K as 1/40th of the calculated characteristic life at 300K as shown in the next figure.
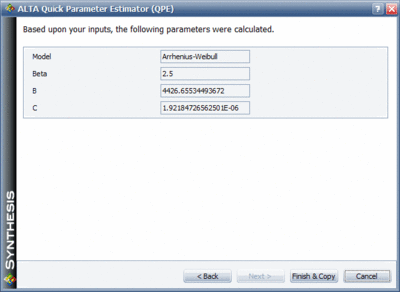
Based on that information the parameters of the Arrhenius-Weibull model can be determined as shown next.
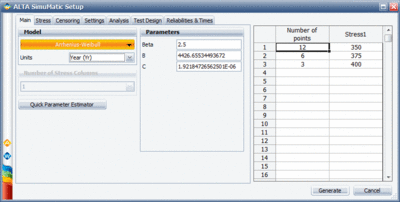
The next step is to determine the stress levels and the allocated test units at each level. The engineer chooses to start the analysis with a sample size of 21 components and use a 4:2:1 allocation scheme at the three temperature levels. The next figure shows the SimuMatic window that includes the allocated units at each temperature level and the calculated Arrhenius-Weibull parameters.
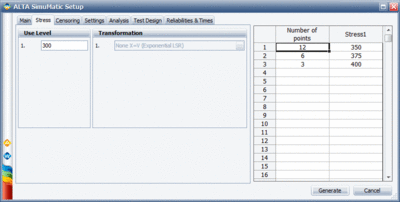
The next figure shows the setting of the use temperature in SimuMatic.
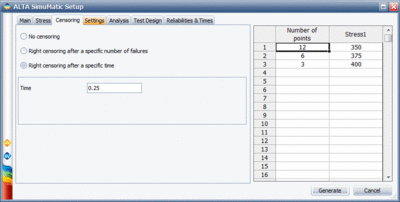
Since the available test time is 3 months, all the failure times generated by SimuMatic that are higher than that should be treated as suspensions at 3 months. This setting is shown in the next figure (note that the time unit is years).
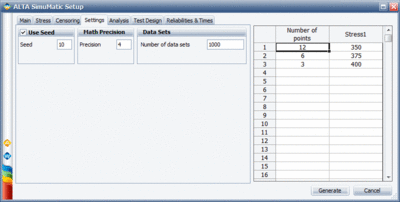
The next figure shows the simulation settings in SimuMatic where it was chosen to generate 1,000 data sets.
Finally, the next three figures show the set confidence level of 90%, the set reliability target of 90% with a 90% confidence and the setting to display the calculated time for a reliability of 90%.
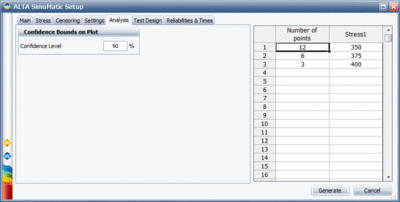
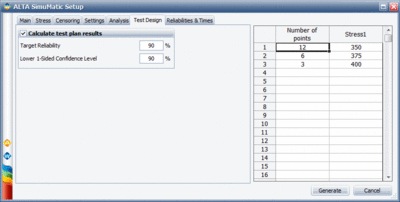
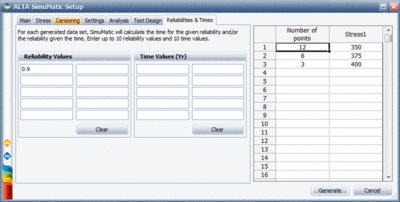
With these settings, SimuMatic will generate 1,000 data sets. Then next figure shows the tab named "Sorted", where the results are sorted.
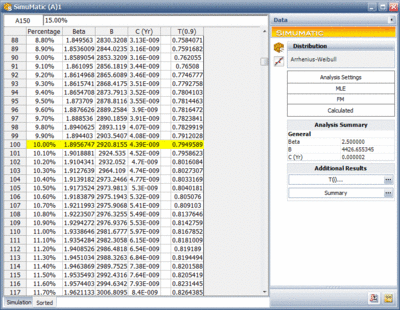
As it can be seen the lower 1-sided 90% bound on the time that corresponds to a 90% reliability is 0.7949589 years which is lower than the required 1 year. The same simulation results and calculated confidence bounds can also be seen in the following plot.
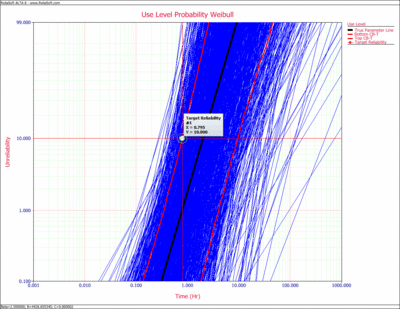
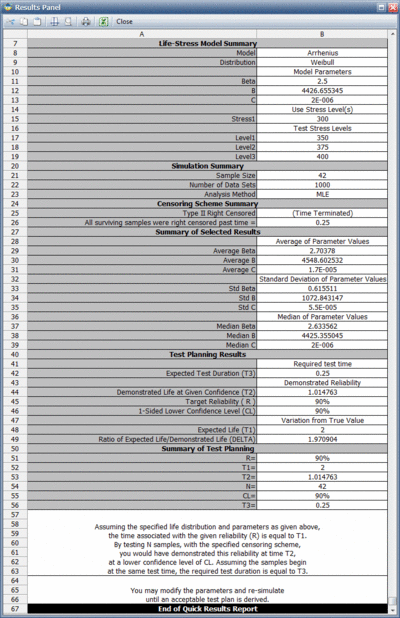
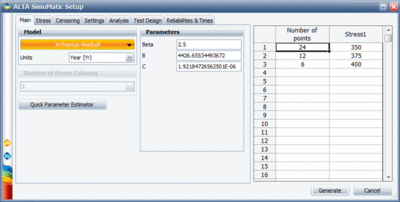
Since the target reliability has not been demonstrated with the chosen sample size the engineer needs to run simulations with an increased sample size until the target is met. Through this process, it was found that the target is met with a sample size of 42 components. The next figure shows the SimuMatic setup window.
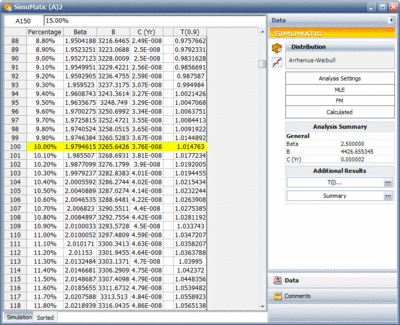
The next figure shows the sorted results were it can be seen that the lower 1-sided 90% confidence limit on the B10 life is above the target of 1 year.
The same result can be seen in results report of SimuMatic as shown in the next figure.
