Overlay Plot Example
 |
New format available! This reference is now available in a new format that offers faster page load, improved display for calculations and images and more targeted search.
As of January 2024, this Reliawiki page will not continue to be updated. Please update all links and bookmarks to the latest references at BlockSim examples and BlockSim reference examples.
Overlay Plot
BlockSim gives you the ability to place results from more than one RBD, fault tree and/or phase diagram on a single plot using an overlay plot. You must have two or more analyzed diagrams, fault trees and/or phase diagrams within the current project in order to plot multiple diagrams in an overlay plot diagram.
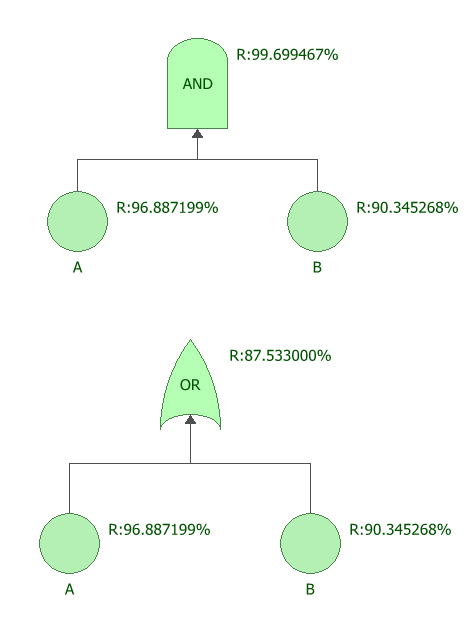
Consider two component A and B, with Weibull(Beta=1.5, Eta=1000) and Weibull(Beta=1.1, Eta=800) respectively. Next we will use overlay plot to plot their results in one plot.
With mission time as 100 hours, the reliability of OR gate and AND gate are show in the figures below.

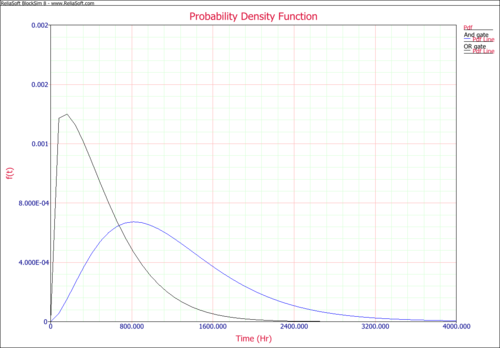
Probability Density Function
The Probability Density Functions for AND gate and OR gate are are plotted in a overlay plot as figure below. The blue line is the AND gate and the black line is the OR gate.

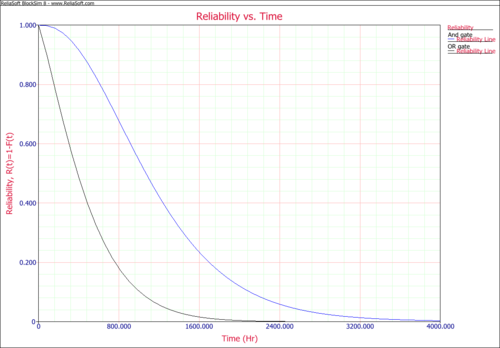
Reliability vs. Time
The reliability plot for both gates are in figure below.
