Two Level Optimum Test Plan for One Stress
ALTA_Reference_Examples_Banner.png
|
ALTA_Reference_Examples |
This example compares the results for the 2-Level Statistically Optimum test plan for one stress.
Reference Case
The data set is from Example 20.5 on page 542 in the book Statistical Methods for Reliability Data by Dr. Meeker and Dr. Escobar, John Wiley & Sons, 1998.
Data
A Weibull distribution with an Arrhenius life stress relationship is used. The Arrhenius relationship uses the following formula:
- [math]\displaystyle{ ln(\eta) = \beta_{0} + \beta_{1} \times \frac{11605}{T}\,\! }[/math]
The planning values of the model parameters for the test plan are [math]\displaystyle{ \beta\,\! }[/math] = 1.667, [math]\displaystyle{ \beta_{0}\,\! }[/math] = -16.7333 and [math]\displaystyle{ \beta_{1}\,\! }[/math] = 0.7265. These planning values were obtained based on the following assumptions: 0.1% of the units will fail in 6 months (183 hours) at 50°C, and 90% will fail in 6 months at 120°C. This information is given in Example 20.2 on page 535.
The use temperature is 50°C (323.15°K) and the highest temperature that can be used in the test is 120°C (393.15 °K).
A total of 300 units are available for testing. The objectives of the test plan are to:
- Determine the two temperature levels that should be used in the test.
- Determine the number of test units at each temperature level.
Tests will be conducted using the created test plan. The failure data from the test will be used to estimate the model parameters, which will then be used to calculate the B10 life at 50°C and its variance. Therefore, we need a test plan that will minimize the estimation variance for the B10 life at 50°C.
Result
The two-level statistically optimum test plan is:
- 212 units should be tested at 95°C (368.15 °K)
- 88 units should be tested at 120°C (393.15 °K).
Based on this test plan, the estimated standard error for the B10 life at 50°C is [math]\displaystyle{ Ase\left [log \left(\hat{t}_{0.1}(50) \right) \right] = 0.3794\,\! }[/math].
Results in ALTA
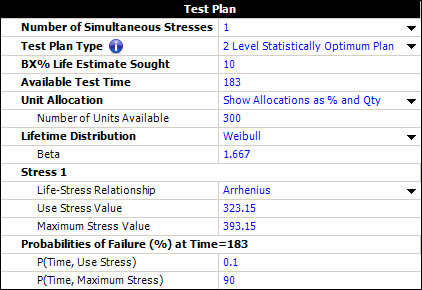
The planning information is entered in ALTA, as shown below.
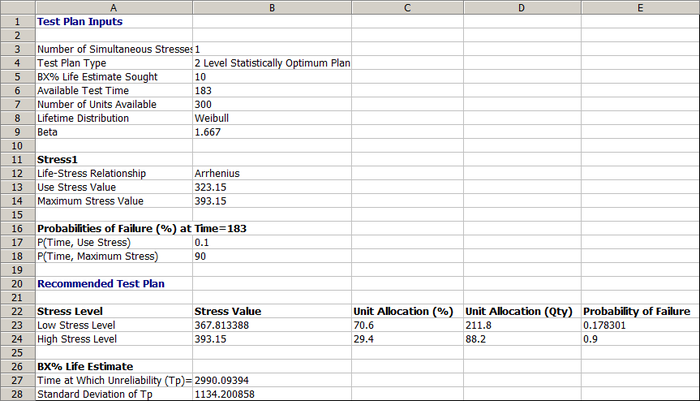
The resulting two-level statistically optimum test plan in ALTA is shown below.
This test plan shows that (starting at row 23 in the picture above):
- The low stress level should be 367.8°K (94.65°C) and about 212 units should be tested at this temperature.
- The high stress level should be 393.15°K (120°C) and about 88 units should be tested at this temperature.
The results above are the same as the results given in the book.
The estimated standard deviation of the log B10 life at 50°C can be calculate from the values given in the BX% Life Estimate area (row 26) of the results shown above.
- [math]\displaystyle{ Ase\left[log \left(\hat{t}_{0.1}(50) \right) \right] = \frac{Ase\left(\hat{t}_{0.1}(50)\right)}{\hat{t}_{0.1}(50)} = \frac{1134.2}{2990.09} = 0.37932\,\! }[/math]
This is very close to the estimated standard deviation in the book. The difference is likely due to rounding error.

