Unused files
Jump to navigation
Jump to search
The following files exist but are not embedded in any page. Please note that other websites may link to a file with a direct URL, and so may still be listed here despite being in active use.
Showing below up to 50 results in range #1,201 to #1,250.
-
 Compexample18formula.png 144 × 103; 1,014 bytes
-
 Compexample18formula2.png 214 × 98; 1 KB
-
 Ex18folioparameterbounds.png 751 × 518; 85 KB
-
 Example19formula.png 241 × 56; 943 bytes
-
 Compexample19formula.png 363 × 53; 1 KB
-
 Example19formula6.11.png 517 × 551; 9 KB
-
 8.14.gif 1,609 × 1,200; 256 KB
-
 QSP.png 81 × 66; 4 KB
-
 QCP icon.png 26 × 26; 1 KB
-
 Data for Example 11.png 651 × 578; 49 KB
-
 Data Type.png 754 × 553; 46 KB
-
 Data Type Example 13.png 754 × 553; 46 KB
-
 Data Type for Example 14.png 754 × 553; 47 KB
-
 Example18table6.9.png 514 × 342; 8 KB
-
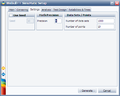
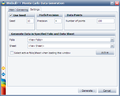
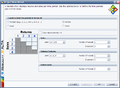
 SimuMatic Parameters.png 512 × 408; 23 KB
-
 SimuMatic Censoring.png 512 × 408; 22 KB
-
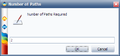
 SimuMatic Number of Data Sets.png 512 × 408; 23 KB
-
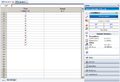 Exponential Distribution Exampe 3 Data Folio.png 847 × 579; 52 KB
-
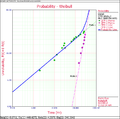
 Exponential Distribution Exampe 3 Plot.png 587 × 526; 23 KB
-
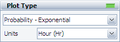 Exponential Distribution Example 8 Plot Type.png 211 × 74; 4 KB
-
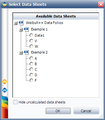
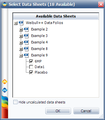 Exp Distribution Example 9 Select Data Set.png 324 × 370; 18 KB
-
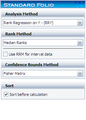 Weibull Distribution Example 3 Select RRY.png 246 × 343; 17 KB
-
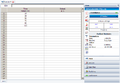 Weibull Distribution Example 3 RRY Result.png 847 × 587; 48 KB
-
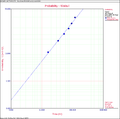 Weibull Distribution Example 3 RRY Plot.png 781 × 772; 34 KB
-
 Weibull Distribution Example 3 RRY Data.png 847 × 563; 44 KB
-
 Weibull Distribution Example 18 QCP.png 925 × 478; 73 KB
-
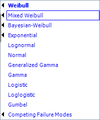 Mixed Weibull Distribution Dropdown.png 201 × 242; 5 KB
-
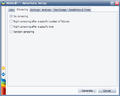
 Gumbel Distribution Example 1 Simulation Setting.png 512 × 408; 27 KB
-
 Competing Failiure Mode Example 1 Data.png 847 × 594; 58 KB
-
 Competing Failiure Mode Example 1 Plot.png 781 × 772; 51 KB
-
 Competing Failure Mode Example 2 Adding Block.png 324 × 370; 17 KB
-
 Competing Failure Mode Example 2 Node Path.png 381 × 177; 12 KB
-
 Warranty Example 1 Setup.png 754 × 553; 59 KB
-
 Warranty Example 1 Sale.png 729 × 465; 37 KB
-
 Warranty Example 1 Return.png 861 × 505; 37 KB
-
 Warranty Example 1 Standard Folio Data.png 861 × 548; 49 KB
-
 Recurrent Data Example 3 Data.png 861 × 469; 44 KB
-
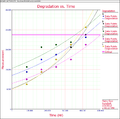 Degradation Example 1 Plot.png 781 × 772; 56 KB
-
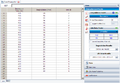 Degradation Example 1 Data and Result.png 847 × 589; 60 KB
-
 Rsik Analysis Example Selected Life Data.png 550 × 421; 22 KB
-
 Lda6.9.gif 612 × 565; 17 KB
-
 Apa fig3.gif 403 × 422; 50 KB
-
 Nicolette.jpg 1,024 × 768; 68 KB
-
 Select Equation Fit Solver.png 180 × 341; 14 KB
-
 Event Log Settings.png 250 × 547; 11 KB
-
 Event Log Results.png 854 × 671; 49 KB
-
 Event Log Report.png 670 × 683; 22 KB
-
 Select Non Parametric LDA.png 192 × 219; 10 KB
-
 Kaplan Meier View Results.png 211 × 47; 2 KB
-
 Bebers.jpg 455 × 270; 34 KB


