Uncategorized files
Jump to navigation
Jump to search
Showing below up to 50 results in range #1,651 to #1,700.
-
 Ex8.5.gif 626 × 412; 47 KB
-
 Ex8.6.gif 628 × 414; 52 KB
-
 Ex9solution.gif 388 × 437; 35 KB
-
 Ex9solution2.gif 388 × 437; 36 KB
-
 Example15formula.png 134 × 119; 1 KB
-
 Example15formula2.png 174 × 95; 1 KB
-
 Example16formula.png 134 × 82; 924 bytes
-
 Example16formula2.png 203 × 91; 1 KB
-
 Example16formula3.png 454 × 156; 2 KB
-
 Example16table.png 800 × 236; 40 KB
-
 Example17formulamle.png 167 × 117; 1 KB
-
 Example17formulamle2.png 179 × 125; 1 KB
-
 Example18autogroupdata.png 340 × 304; 13 KB
-
 Example18formula.png 131 × 95; 985 bytes
-
 Example18formula2.png 214 × 98; 1 KB
-
 Example18formula3.png 437 × 167; 3 KB
-
 Example18table.png 514 × 342; 8 KB
-
 Example18table6.9.png 514 × 342; 8 KB
-
 Example19formula.png 241 × 56; 943 bytes
-
 Example19formula6.11.png 517 × 551; 9 KB
-
 Example 1 life vs stress.gif 1,114 × 859; 44 KB
-
 Example 1 life vs stress with cb.gif 1,114 × 859; 45 KB
-
 Example 1 use prob plot with cb.gif 1,114 × 859; 40 KB
-
 Examplecontourplot.gif 307 × 562; 13 KB
-
 Examplecontourplot.png 500 × 625; 86 KB
-
 Examples heading.png 250 × 36; 11 KB
-
 Examples icon.png 38 × 36; 3 KB
-
 Examples link.png 16 × 16; 676 bytes
-
 Examples movie.png 16 × 16; 2 KB
-
 Excelsheet.png 614 × 500; 28 KB
-
 Exp Distribution Example 9 6MP Data.png 847 × 587; 60 KB
-
 Exp Distribution Example 9 Data.png 847 × 628; 62 KB
-
 Exp Distribution Example 9 Placebo Data.png 847 × 587; 58 KB
-
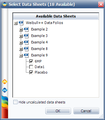 Exp Distribution Example 9 Select Data Set.png 324 × 370; 18 KB
-
 Exp Distribution Example Overlay Plot.png 781 × 792; 48 KB
-
 Expected Failure Plot 0.1 Rank.png 592 × 401; 36 KB
-
 Expected Failure Plot 0.9 Rank.png 592 × 401; 36 KB
-
 Expected Failure Plot Median Rank.png 592 × 401; 35 KB
-
 Expected Failure Plot example Result Plot.png 781 × 802; 23 KB
-
 Expected Failure Plot example Result Summary.png 633 × 420; 30 KB
-
 Exponential Distribution Exampe 3 Data Folio.png 847 × 579; 52 KB
-
 Exponential Distribution Exampe 3 Plot.png 587 × 526; 23 KB
-
 Exponential Distribution Example 3 Data Folio.png 847 × 579; 53 KB
-
 Exponential Distribution Example 3 Plot.png 587 × 526; 23 KB
-
 Exponential Distribution Example 4 Data.png 847 × 579; 52 KB
-
 Exponential Distribution Example 4 Plot.png 587 × 526; 22 KB
-
 Exponential Distribution Example 8 Data.png 847 × 539; 46 KB
-
 Exponential Distribution Example 8 Failure Rate Plot.png 781 × 772; 33 KB
-
 Exponential Distribution Example 8 Pdf Plot.png 781 × 772; 32 KB
-
 Exponential Distribution Example 8 Plot.png 781 × 772; 36 KB


