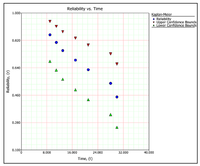
Weibull++ Non-Parametric LDA Plot
 |
| Non-parametric LDA Plot |
| Weibull++ |
|
The Reliability vs. Time plot shows the reliability values over time, capturing trends in the product’s failure behavior Example: |
| Weibull++ Plots |
Learn more from...
| the help files... | |
| the theory textbook... | |
| related article(s)... | |
| use example(s)... |

