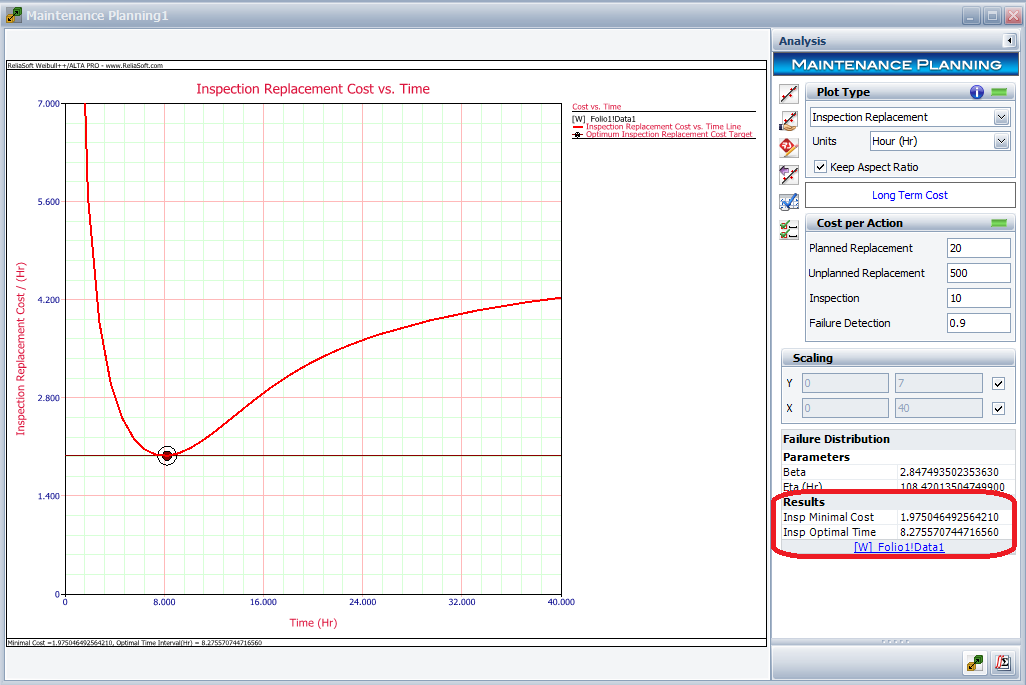
File:Long term optimal inspection plot.png
Size of this preview: 800 × 534 pixels. Other resolution: 1,026 × 685 pixels.
Original file (1,026 × 685 pixels, file size: 74 KB, MIME type: image/png)
File history
Click on a date/time to view the file as it appeared at that time.
| Date/Time | Thumbnail | Dimensions | User | Comment | |
|---|---|---|---|---|---|
| current | 17:27, 22 November 2013 | | 1,026 × 685 (74 KB) | John Leavitt (talk | contribs) | |
| 22:58, 11 September 2013 | 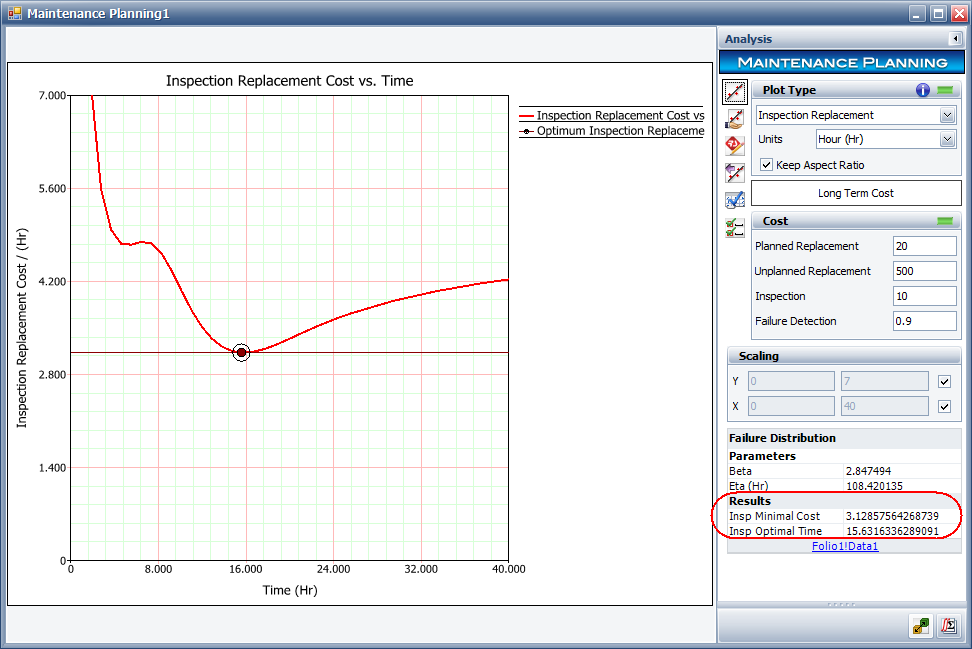 | 972 × 649 (65 KB) | Kate Racaza (talk | contribs) | ||
| 22:53, 11 September 2013 | 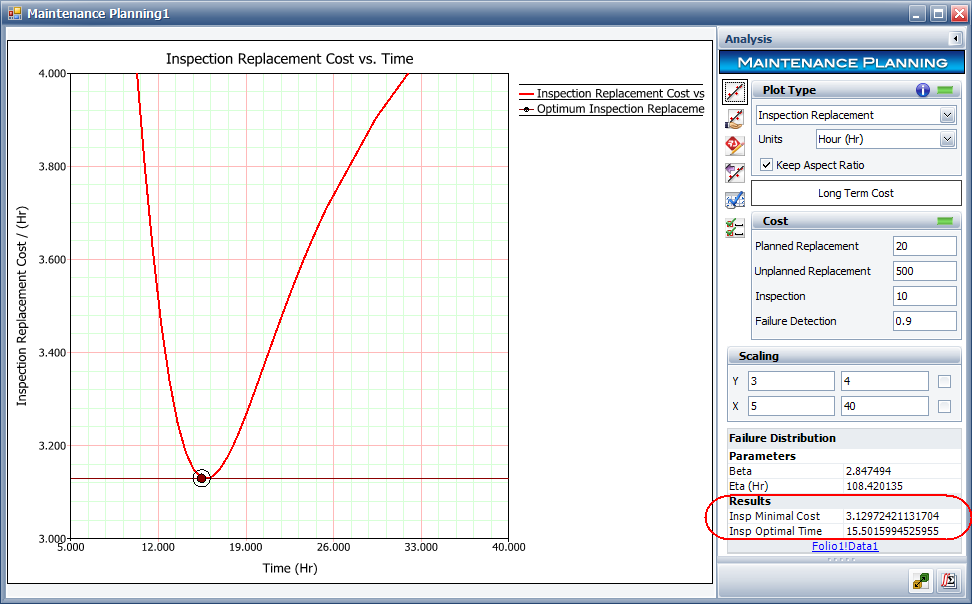 | 972 × 604 (65 KB) | Kate Racaza (talk | contribs) | ||
| 22:51, 11 September 2013 | 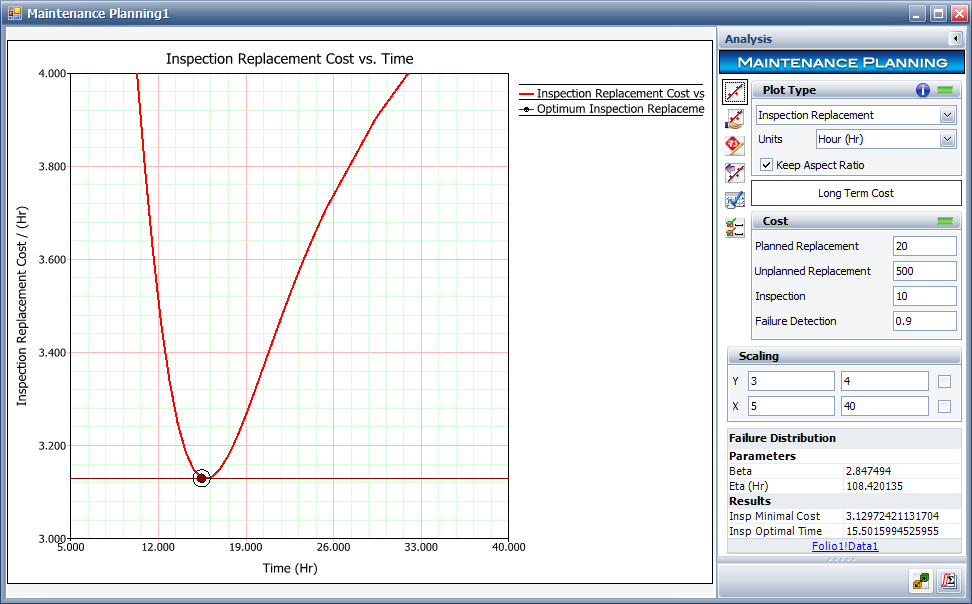 | 972 × 604 (64 KB) | Kate Racaza (talk | contribs) |
You cannot overwrite this file.
File usage
The following 2 pages use this file: