Exponential Distribution Auto Batch Run Example
New format available! This reference is now available in a new format that offers faster page load, improved display for calculations and images and more targeted search.
As of January 2024, this Reliawiki page will not continue to be updated. Please update all links and bookmarks to the latest references at Weibull examples and Weibull reference examples.
This example appears in the Life Data Analysis Reference book.
A number of leukemia patients were treated with either drug 6 MP or a placebo, and the times in weeks until cancer symptoms returned were recorded. Analyze each treatment separately [21, p.175].
| Table - Leukemia Treatment Results | |||
| Time (weeks) | Number of Patients | Treament | Comments |
|---|---|---|---|
| 1 | 2 | placebo | |
| 2 | 2 | placebo | |
| 3 | 1 | placebo | |
| 4 | 2 | placebo | |
| 5 | 2 | placebo | |
| 6 | 4 | 6MP | 3 patients completed |
| 7 | 1 | 6MP | |
| 8 | 4 | placebo | |
| 9 | 1 | 6MP | Not completed |
| 10 | 2 | 6MP | 1 patient completed |
| 11 | 2 | placebo | |
| 11 | 1 | 6MP | Not completed |
| 12 | 2 | placebo | |
| 13 | 1 | 6MP | |
| 15 | 1 | placebo | |
| 16 | 1 | 6MP | |
| 17 | 1 | placebo | |
| 17 | 1 | 6MP | Not completed |
| 19 | 1 | 6MP | Not completed |
| 20 | 1 | 6MP | Not completed |
| 22 | 1 | placebo | |
| 22 | 1 | 6MP | |
| 23 | 1 | placebo | |
| 23 | 1 | 6MP | |
| 25 | 1 | 6MP | Not completed |
| 32 | 2 | 6MP | Not completed |
| 34 | 1 | 6MP | Not completed |
| 35 | 1 | 6MP | Not completed |
Solution
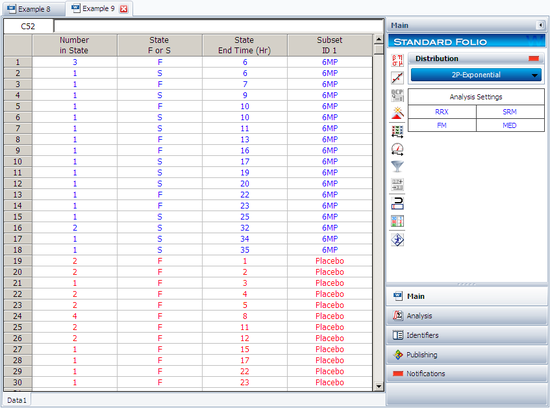
Enter the data into Weibull++, by selecting Times to Failure, with Right Censored Data (Suspensions)' and with Grouped Observations. In the first column enter the number of patients. Whenever there are uncompleted tests, enter the number of patients who completed the test separately from the number of patients who did not. In the second column enter F for completed tests and S for uncompleted. In the third column enter the time. In the fourth column (Subset ID) enter the name of the treatment. The title of each column can be changed by double-clicking it and typing the desired name.
Now click the Batch Auto Run icon
or:
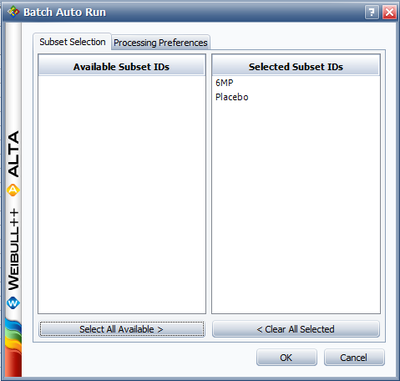
and click Select All Available> > to separate the 6 MP drug from the placebo as shown next.
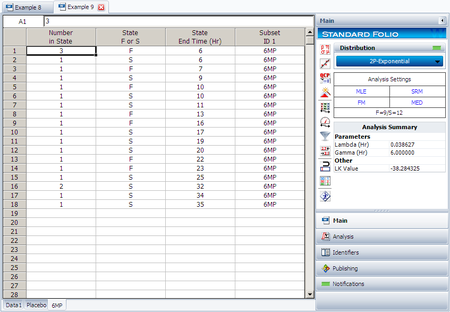
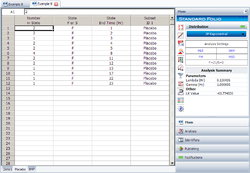
Click OK and you will get a new Data Sheet for each treatment with the corresponding results, as shown next.
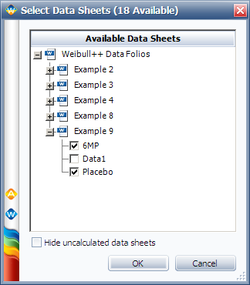
Make sure both data sheets are calculated, then from the Life Data tab, click on Insert Additional Plot. Click on the Select Data Sheets button.
and check the two data sheets.
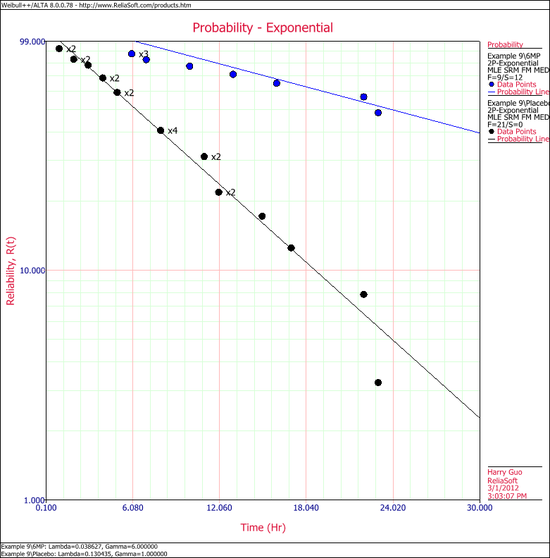
The plot is shown next,

