Known Operating Times - Crow Extended Example
 |
New format available! This reference is now available in a new format that offers faster page load, improved display for calculations and images and more targeted search.
As of January 2024, this Reliawiki page will not continue to be updated. Please update all links and bookmarks to the latest references at RGA examples and RGA reference examples.
This example appears in the Reliability Growth and Repairable System Analysis Reference.
Two prototypes of a new design are tested simultaneously. Whenever a failure is observed for one unit, the current operating time of the other unit is also recorded. The test is terminated after 300 hours. All of the design changes for the prototypes were delayed until after completing the test. The data set is given in the table below. Assume a fixed effectiveness factor equal to 0.7. The MTBF goal for the new design is 30 hours. Do the following:
- Estimate the parameters of the Crow Extended model.
- What is the projected MTBF and growth potential?
- Under the current management strategy, is it even possible to reach the MTBF goal of 30 hours?
| Multiple Systems (Known Operating Times) Data | ||||
| Failed Unit ID | Time Unit 1 | Time Unit 2 | Classification | Mode |
|---|---|---|---|---|
| 1 | 16.5 | 0 | BD | seal leak |
| 1 | 16.5 | 0 | BD | valve |
| 1 | 17 | 0 | A | |
| 2 | 20.5 | 0.9 | A | |
| 2 | 25.3 | 3.8 | BD | hose |
| 2 | 28.7 | 4.6 | BD | operator error |
| 1 | 41.8 | 14.7 | BD | bearing |
| 1 | 45.5 | 17.6 | A | |
| 2 | 48.6 | 22 | A | |
| 2 | 49.6 | 23.4 | BD | seal leak |
| 1 | 51.4 | 26.3 | A | |
| 1 | 58.2 | 35.7 | BD | seal leak |
| 2 | 59 | 36.5 | A | |
| 2 | 60.6 | 37.6 | BD | hose |
| 1 | 61.9 | 39.1 | BD | seal leak |
| 1 | 76.6 | 55.4 | BD | bearing |
| 2 | 81.1 | 61.1 | A | |
| 1 | 84.1 | 63.6 | A | |
| 1 | 84.7 | 64.3 | A | |
| 1 | 94.6 | 72.6 | A | |
| 2 | 100 | 78.1 | BD | valve |
| 1 | 104 | 81.4 | BD | bearing |
| 2 | 104.8 | 85.9 | BD | spring |
| 2 | 105.9 | 87.1 | BD | operator error |
| 1 | 108.8 | 89.9 | BD | hose |
| 2 | 132.4 | 119.5 | BD | spring |
| 2 | 132.4 | 150.1 | BD | operator error |
| 2 | 132.4 | 153.7 | A | |
Solution
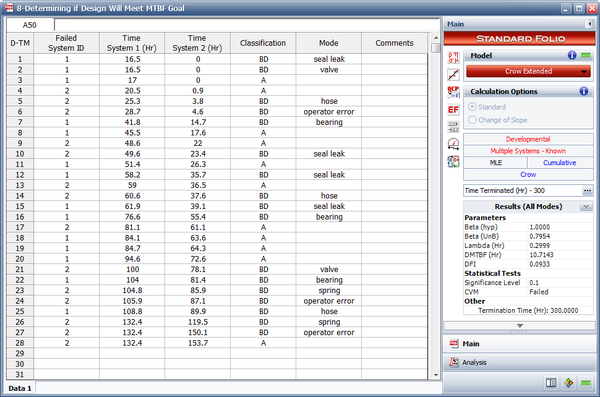
- The next figure shows the estimated Crow Extended parameters.
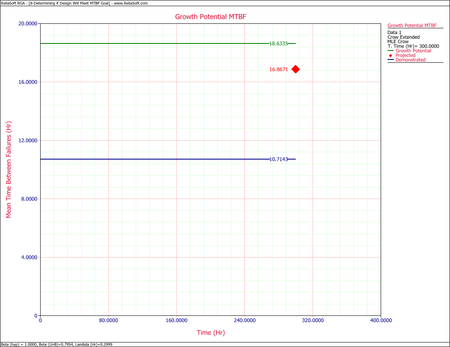
- One possible method for calculating the projected MTBF and growth potential is to use the Quick Calculation Pad, but you can also view these two values at the same time by viewing the Growth Potential MTBF plot, as shown next. From the plot, the projected MTBF is equal to 16.87 hours and the growth potential is equal to 18.63 hours.
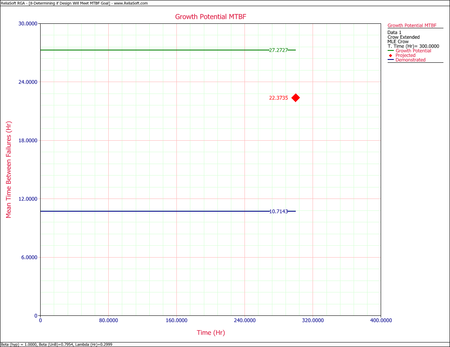
- The current projected MTBF and growth potential MTBF are both well below the required goal of 30 hours. To check if this goal can even be reached, you can set the effectiveness factor equal to 1. In other words, if all of the corrective actions were to remove the failure modes completely, what would be the projected and growth potential MTBF?
Change the fixed effectiveness factor to 1, then recalculate the parameters and refresh the Growth Potential plot, as shown next. Even if you assume an effectiveness factor equal to 1, the growth potential is still only 27.27 hours. Based on the current design process, it will not be possible to reach the MTBF goal of 30 hours. Therefore, you have two options: start a new design stage or reduce the required MTBF goal.