Life Comparison Wizard: Difference between revisions
Jump to navigation
Jump to search
Lisa Hacker (talk | contribs) No edit summary |
Lisa Hacker (talk | contribs) No edit summary |
||
| Line 9: | Line 9: | ||
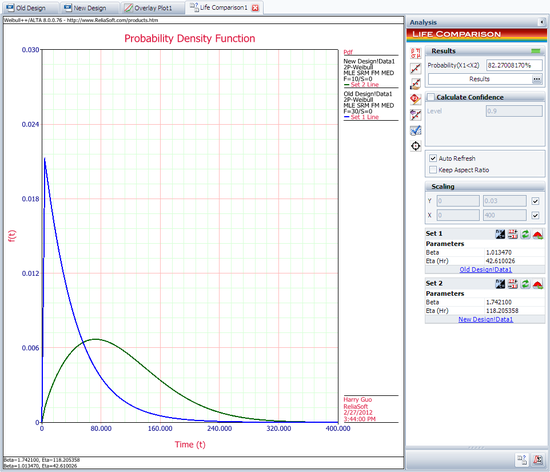
The next figure shows the ''pdf'' curves and the result of the comparison. | The next figure shows the ''pdf'' curves and the result of the comparison. | ||
[[Image:Life Comparison Example 2 pdf Plot and Result.png | [[Image:Life Comparison Example 2 pdf Plot and Result.png|center|550px| ]] | ||
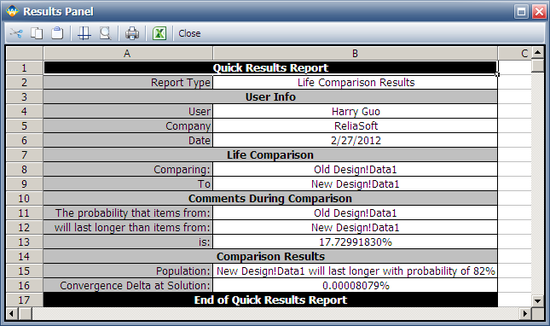
The comparison summary is given in the Results Panel window. | The comparison summary is given in the Results Panel window. | ||
[[Image:Life Comparison Example 2 pdf Result Summary.png | [[Image:Life Comparison Example 2 pdf Result Summary.png|center|550px| ]] | ||
Revision as of 08:43, 14 August 2012
Life Comparison - Compare Two Designs Using the Life Comparison Tool
Using the same data set from the contour plots example, use Weibull++'s Life Comparison tool to estimate the probability that units from the new design will outlast units from the old design.
Solution
After entering the data sets into two different folios (or two data sheets within the same folio) and analyzing them (in this case, the two data sets were analyzed using the two-parameter Weibull distribution and MLE), open the Life Comparison tool and select to compare the two data sets.
The next figure shows the pdf curves and the result of the comparison.

The comparison summary is given in the Results Panel window.
