Logistic Model - Auto Transmission Example: Difference between revisions
Jump to navigation
Jump to search
Chris Kahn (talk | contribs) No edit summary |
Lisa Hacker (talk | contribs) No edit summary |
||
| (2 intermediate revisions by 2 users not shown) | |||
| Line 1: | Line 1: | ||
<noinclude>{{Banner RGA Examples}} | <noinclude>{{Banner RGA Examples}} | ||
''This example appears in the [ | ''This example appears in the [https://help.reliasoft.com/reference/reliability_growth_and_repairable_system_analysis Reliability growth reference]''. | ||
</noinclude> | </noinclude> | ||
| Line 42: | Line 42: | ||
'''Solution ''' | '''Solution ''' | ||
<ol> | <ol> | ||
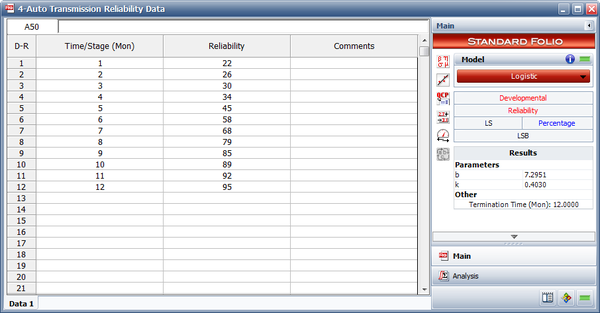
<li>The next figure shows the estimated parameters. | <li>The next figure shows the entered data and the estimated parameters. | ||
<br> | <br> | ||
[[Image:rga8.7.png | [[Image:rga8.7.png|center|600px]] | ||
<br> | <br> | ||
</li> | </li> | ||
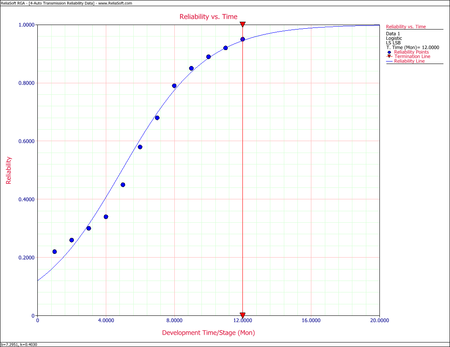
<li>The next figure displays the Reliability vs. Time plot. | <li>The next figure displays the Reliability vs. Time plot. | ||
<br> | <br> | ||
[[Image:rga8.8.png | [[Image:rga8.8.png|center|450px]] | ||
<br> | <br> | ||
</li> | </li> | ||
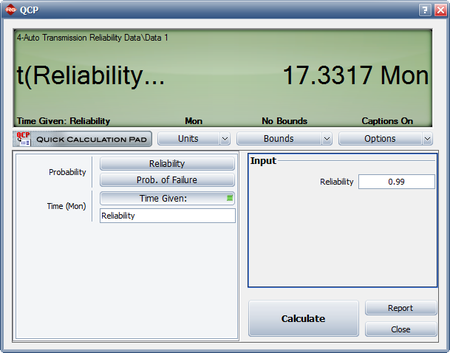
<li>Using the QCP, the next figure displays when the reliability goal of 99% will be achieved. | <li>Using the QCP, the next figure displays, in months, when the reliability goal of 99% will be achieved. | ||
<br> | <br> | ||
[[Image:rga8.9.png | [[Image:rga8.9.png|center|450px]] | ||
<br> | <br> | ||
</li> | </li> | ||
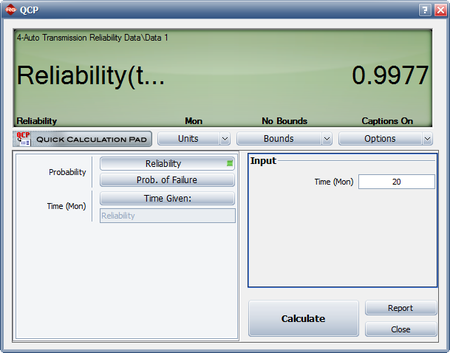
<li>The last figure shows the reliability at the end of January the following year (i.e., after 20 months of testing and development). | <li>The last figure shows the reliability at the end of January the following year (i.e., after 20 months of testing and development). | ||
<br> | <br> | ||
[[Image:rga8.10.png | [[Image:rga8.10.png|center|450px]] | ||
<br> | <br> | ||
</li> | </li> | ||
</ol> | </ol> | ||
Latest revision as of 21:21, 18 September 2023
 |
New format available! This reference is now available in a new format that offers faster page load, improved display for calculations and images and more targeted search.
As of January 2024, this Reliawiki page will not continue to be updated. Please update all links and bookmarks to the latest references at RGA examples and RGA reference examples.
This example appears in the Reliability growth reference.
The following table presents the reliabilities observed monthly for an automobile transmission that was tested for one year.
- Find a Logistic reliability growth curve that best represents the data.
- Plot it comparatively with the raw data.
- If design changes continue to be incorporated and the testing continues, when will the reliability goal of 99% be achieved?
- If design changes continue to be incorporated and the testing continues, what will be the attainable reliability at the end of January the following year?
| Month | Observed Reliability(%) |
|---|---|
| June | 22 |
| July | 26 |
| August | 30 |
| September | 34 |
| October | 45 |
| November | 58 |
| December | 68 |
| January | 79 |
| February | 85 |
| March | 89 |
| April | 92 |
| May | 95 |
Solution
- The next figure shows the entered data and the estimated parameters.
- The next figure displays the Reliability vs. Time plot.
- Using the QCP, the next figure displays, in months, when the reliability goal of 99% will be achieved.
- The last figure shows the reliability at the end of January the following year (i.e., after 20 months of testing and development).