Logistic Model - Missile Launch Test Example: Difference between revisions
Chris Kahn (talk | contribs) No edit summary |
Chris Kahn (talk | contribs) No edit summary |
||
| Line 60: | Line 60: | ||
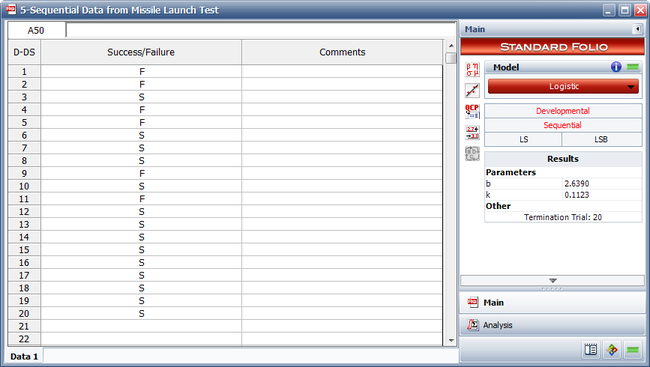
<li>The next figure shows the entered data and the estimated parameters. | <li>The next figure shows the entered data and the estimated parameters. | ||
<br> | <br> | ||
[[Image:rga8.11.png | [[Image:rga8.11.png|center|650px|Entered data and the estimated logistic parameters.]]</li> | ||
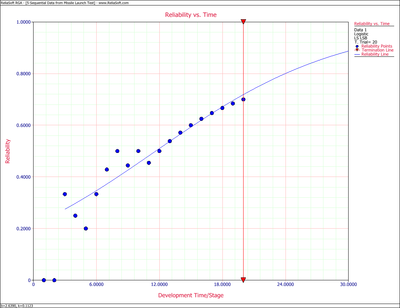
<li>The next figure displays the Reliability vs. Time plot. | <li>The next figure displays the Reliability vs. Time plot. | ||
<br> | <br> | ||
[[Image:rga8.12.png | [[Image:rga8.12.png|center|400px|Reliability vs. Time plot.]]</li> | ||
<li>The next figure displays | <li>The next figure displays the number of launches before the reliability goal of 99.5% will be achieved with a 90% confidence level. | ||
<br> | <br> | ||
[[Image:rga8.13.png|thumb|center|400px|When the reliability goal of 99.5% with a 90% confidence level will be achieved.]]</li> | [[Image:rga8.13.png|thumb|center|400px|When the reliability goal of 99.5% with a 90% confidence level will be achieved.]]</li> | ||
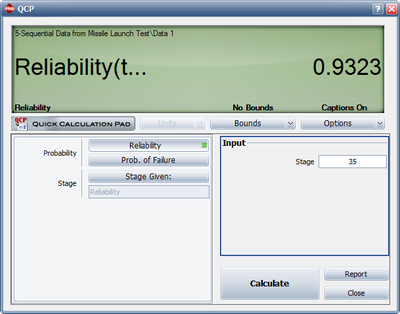
<li>The next figure displays the reliability achieved after the 35th launch. | <li>The next figure displays the reliability achieved after the 35th launch. | ||
<br> | <br> | ||
[[Image:rga8.14.png | [[Image:rga8.14.png|center|400px|The reliability at the end of the 35th launch.]]</li> | ||
</ol> | </ol> | ||
Revision as of 17:22, 12 June 2014
 |
New format available! This reference is now available in a new format that offers faster page load, improved display for calculations and images and more targeted search.
As of January 2024, this Reliawiki page will not continue to be updated. Please update all links and bookmarks to the latest references at RGA examples and RGA reference examples.
This example appears in the Reliability Growth and Repairable System Analysis Reference.
The following table presents the results for a missile launch test. The test consisted of 20 attempts. If the missile launched, it was recorded as a success. If not, it was recorded as a failure. Note that, at this development stage, the test did not consider whether or not the target was destroyed.
- Find a Logistic reliability growth curve that best represents the data.
- Plot it comparatively with the raw data.
- If design changes continue to be incorporated and the testing continues, when will the reliability goal of 99.5% with a 90% confidence level be achieved?
- If design changes continue to be incorporated and the testing continues, what will be the attainable reliability at the end of the 35th launch?
| Launch Number | Result |
|---|---|
| 1 | F |
| 2 | F |
| 3 | S |
| 4 | F |
| 5 | F |
| 6 | S |
| 7 | S |
| 8 | S |
| 9 | F |
| 10 | S |
| 11 | F |
| 12 | S |
| 13 | S |
| 14 | S |
| 15 | S |
| 16 | S |
| 17 | S |
| 18 | S |
| 19 | S |
| 20 | S |
Solution
- The next figure shows the entered data and the estimated parameters.
- The next figure displays the Reliability vs. Time plot.
- The next figure displays the number of launches before the reliability goal of 99.5% will be achieved with a 90% confidence level.
- The next figure displays the reliability achieved after the 35th launch.