Lognormal Distribution Characteristics: Difference between revisions
Lisa Hacker (talk | contribs) No edit summary |
Lisa Hacker (talk | contribs) |
||
| Line 2: | Line 2: | ||
''This article also appears in the [[The_Lognormal_Distribution|Life Data Analysis Reference]] and [[Distributions_Used_in_Accelerated_Testing|Accelerated Life Testing Data Analysis Reference]] books.'' </noinclude> | ''This article also appears in the [[The_Lognormal_Distribution|Life Data Analysis Reference]] and [[Distributions_Used_in_Accelerated_Testing|Accelerated Life Testing Data Analysis Reference]] books.'' </noinclude> | ||
==Effect of Standard Deviation== | ==Effect of Standard Deviation== | ||
[[Image:WB.10 effect of sigma.png|center| | [[Image:WB.10 effect of sigma.png|center|400px| ]] | ||
<math></math> | <math></math> | ||
Revision as of 02:45, 7 August 2012
This article also appears in the Life Data Analysis Reference and Accelerated Life Testing Data Analysis Reference books.
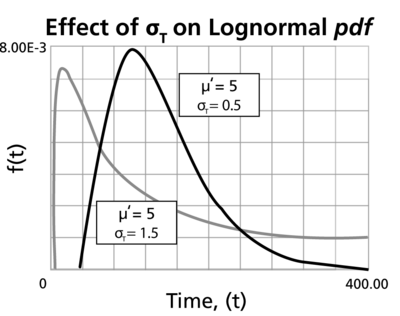
Effect of Standard Deviation
[math]\displaystyle{ }[/math]
- The lognormal distribution is a distribution skewed to the right.
- The [math]\displaystyle{ pdf }[/math] starts at zero, increases to its mode, and decreases thereafter.
- The degree of skewness increases as [math]\displaystyle{ {{\sigma'}} }[/math] increases, for a given [math]\displaystyle{ \mu' }[/math]
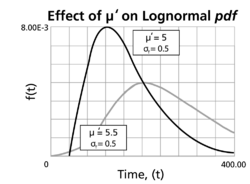
Effect of Mean
- For the same [math]\displaystyle{ {{\sigma'}} }[/math] , the [math]\displaystyle{ pdf }[/math] 's skewness increases as [math]\displaystyle{ {\mu }' }[/math] increases.
- For [math]\displaystyle{ {{\sigma' }} }[/math] values significantly greater than 1, the [math]\displaystyle{ pdf }[/math] rises very sharply in the beginning, i.e. for very small values of [math]\displaystyle{ T }[/math] near zero, and essentially follows the ordinate axis, peaks out early, and then decreases sharply like an exponential [math]\displaystyle{ pdf }[/math] or a Weibull [math]\displaystyle{ pdf }[/math] with [math]\displaystyle{ 0\lt \beta \lt 1 }[/math] .
- The parameter, [math]\displaystyle{ {\mu }' }[/math], in terms of the logarithm of the [math]\displaystyle{ {T}'s }[/math] is also the scale parameter, and not the location parameter as in the case of the normal [math]\displaystyle{ pdf }[/math] .
- The parameter [math]\displaystyle{ {{\sigma'}} }[/math], or the standard deviation of the [math]\displaystyle{ {T}'s }[/math] in terms of their logarithm or of their [math]\displaystyle{ {T}' }[/math], is also the shape parameter and not the scale parameter, as in the normal [math]\displaystyle{ pdf }[/math], and assumes only positive values.
Lognormal Distribution Parameters in ReliaSoft's Software
In ReliaSoft's software, the parameters returned for the lognormal distribution are always logarithmic. That is: the parameter [math]\displaystyle{ {\mu }' }[/math] represents the mean of the natural logarithms of the times-to-failure, while [math]\displaystyle{ {{\sigma' }} }[/math] represents the standard deviation of these data point logarithms. Specifically, the returned [math]\displaystyle{ {{\sigma' }} }[/math] is the square root of the variance of the natural logarithms of the data points. Even though the application denotes these values as mean and standard deviation, the user is reminded that these are given as the parameters of the distribution, and are thus the mean and standard deviation of the natural logarithms of the data. The mean value of the times-to-failure, not used as a parameter, as well as the standard deviation can be obtained through the QCP or the Function Wizard.

