Maintenance Planning Example
New format available! This reference is now available in a new format that offers faster page load, improved display for calculations and images and more targeted search.
As of January 2024, this Reliawiki page will not continue to be updated. Please update all links and bookmarks to the latest references at Weibull examples and Weibull reference examples.
This example appears in the Life Data Analysis Reference book.
Assume that the failure times of a device are recorded and a Weibull distribution is used to model the data. The following picture shows the Weibull++ standard folio that contains the data and distribution. The Weibull distribution has parameters [math]\displaystyle{ \beta }[/math] = 2.847494 and [math]\displaystyle{ \eta }[/math] = 108.420135.
Assume that the average cost for a planned replacement is $20. For an unplanned replacement, the cost is $500. The cost for each inspection is $10 and the fraction of the failure time for detecting an oncoming failure is 0.9. The objectives are:
- Find the optimal inspection interval and the optimal scheduled replacement interval for minimizing the cost in the long term.
- Find the optimal inspection interval and the optimal scheduled replacement interval for minimizing the cost in one replacement cycle.
Solution
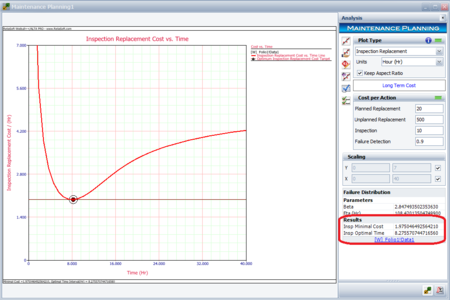
In the Maintenance Planning tool, choose the Inspection Replacement plot type on the control panel, and then enter the estimated costs. Click the Plot icon to calculate the results and draw the plot. The following results show that the optimal inspection time is 15.502 hours, and the optimal cost is about 3.130 dollars per hour.
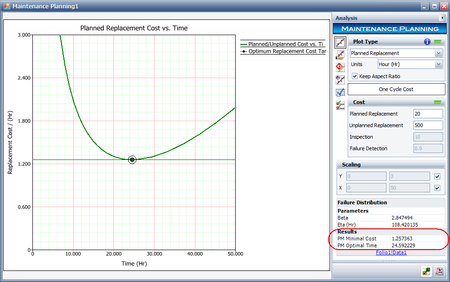
To use a scheduled replacement strategy, choose the Planned Replacement plot type on the control panel, and then click the Plot icon to recalculate results and redraw the plot. The following results show that the optimal replacement interval is about 28.657 hours, and the minimal cost is about $1.079 per hour.
To find the optimal times for minimizing the cost in one replacement cycle, first, select the Plot One Cycle Cost/Time option on the Settings page of the control panel.
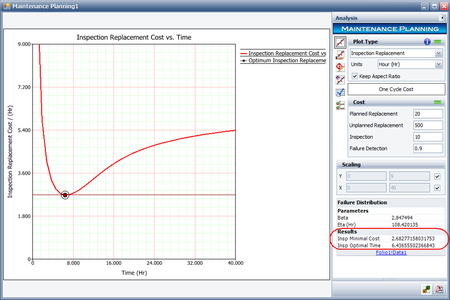
Next, choose the Inspection Replacement plot type on the control panel to find the optimal inspection interval. The results show that the optimal inspection time for one replacement cycle is about 6.313 hours, and the minimal cost is about $2.685 per hour.
Change the plot type to Planned Replacement and recalculate the results. The results show that the optimal replacement interval is about 28.657 hours, and the minimal cost is about $1.079 per hour.
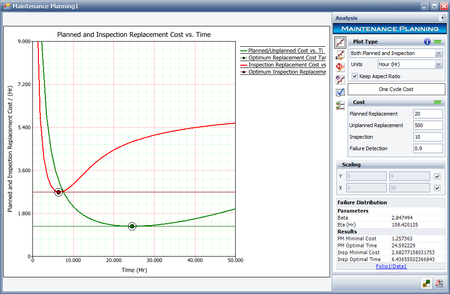
To plot both the planned replacement and inspection replacement plots, choose the Both Planned and Inspection plot type. The results are shown next.


