Median Rank for Single Censored Data: Difference between revisions
Jump to navigation
Jump to search
Kate Racaza (talk | contribs) (Created page with '{{UConstruction}}{{Banner Weibull Articles}}__NOTOC__ This example validates the median rank calculation for complete data. ==Data Source== Table 6.2 on page 283 in the book “'…') |
Kate Racaza (talk | contribs) No edit summary |
||
| Line 52: | Line 52: | ||
[[Image:Median_Ranks.png|center|550px|]] | [[Image:Median_Ranks.png|center|550px|]] | ||
================= | |||
{{Reference Example| | |||
Software=Weibull++| | |||
data source=Table 6.2 on page 283 in the book “''Reliability Engineering Handbook Vol 1''” by Dr. Kececioglu, Prentice-Hall, 1991.| | |||
data= | |||
{| border="1" align="center" style="border-collapse: collapse;" cellpadding="5" cellspacing="5" | |||
|- | |||
|- align="center" | |||
!Num. In Stage | |||
!State F or S | |||
!Time to Failure | |||
|- align="center" | |||
|1 ||F |||16 | |||
|- align="center" | |||
|1 ||F |||34 | |||
|- align="center" | |||
|1 ||F |||53 | |||
|- align="center" | |||
|1 ||F |||75 | |||
|- align="center" | |||
|1 ||F |||93 | |||
|- align="center" | |||
|1 ||F |||120 | |||
|- align="center" | |||
|4 ||S |||200 | |||
|}| | |||
Book result= | |||
{| border="1" align="center" style="border-collapse: collapse;" cellpadding="5" cellspacing="5" | |||
|- | |||
|- align="center" | |||
!Num. In Stage | |||
!State F or S | |||
!Time to Failure | |||
!Median Rank (%) | |||
|- align="center" | |||
|1 ||F |||16 |||6.7 | |||
|- align="center" | |||
|1 ||F |||34 |||16.23 | |||
|- align="center" | |||
|1 ||F |||53 |||25.86 | |||
|- align="center" | |||
|1 ||F |||75 |||35.51 | |||
|- align="center" | |||
|1 ||F |||93 |||45.17 | |||
|- align="center" | |||
|1 ||F |||120 |||54.83 | |||
|- align="center" | |||
|4 ||S |||200 | |||
|}| | |||
software result= The coordinates of each point in the following plot shows the failure time and the corresponding median rank. | |||
[[Image:Median_Ranks.png|center|550px|]]|}} | |||
Revision as of 18:50, 27 May 2014
| UNDER CONSTRUCTION |
| Please come back later. |
 |
This example validates the median rank calculation for complete data.
Data Source
Table 6.2 on page 283 in the book “Reliability Engineering Handbook Vol 1” by Dr. Kececioglu, Prentice-Hall, 1991.
Data
| Num. In Stage | State F or S | Time to Failure |
|---|---|---|
| 1 | F | 16 |
| 1 | F | 34 |
| 1 | F | 53 |
| 1 | F | 75 |
| 1 | F | 93 |
| 1 | F | 120 |
| 4 | S | 200 |
Results
| Num. In Stage | State F or S | Time to Failure | Median Rank (%) |
|---|---|---|---|
| 1 | F | 16 | 6.7 |
| 1 | F | 34 | 16.23 |
| 1 | F | 53 | 25.86 |
| 1 | F | 75 | 35.51 |
| 1 | F | 93 | 45.17 |
| 1 | F | 120 | 54.83 |
| 4 | S | 200 |
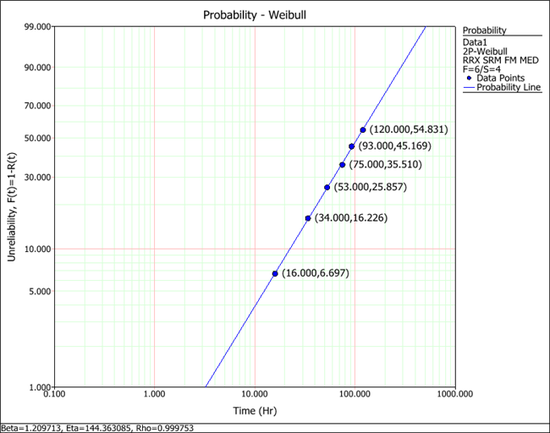
Results from Weibull++
The coordinates of each point in the following plot shows the failure time and the corresponding median rank.

=====
-