Median Rank for Single Censored Data: Difference between revisions
Jump to navigation
Jump to search
Kate Racaza (talk | contribs) No edit summary |
Kate Racaza (talk | contribs) No edit summary |
||
| Line 1: | Line 1: | ||
{{UConstruction}}{{Banner Weibull | {{UConstruction}}{{Banner Weibull Reference Examples}}__NOTOC__ | ||
This example validates the median rank calculation for complete data. | This example validates the median rank calculation for complete data. | ||
==Data Source== | ==Data Source== | ||
| Line 52: | Line 52: | ||
[[Image:Median_Ranks.png|center|550px|]] | [[Image:Median_Ranks.png|center|550px|]] | ||
Revision as of 19:22, 27 May 2014
| UNDER CONSTRUCTION |
| Please come back later. |
 |
New format available! This reference is now available in a new format that offers faster page load, improved display for calculations and images and more targeted search.
As of January 2024, this Reliawiki page will not continue to be updated. Please update all links and bookmarks to the latest references at Weibull examples and Weibull reference examples.
This example validates the median rank calculation for complete data.
Data Source
Table 6.2 on page 283 in the book “Reliability Engineering Handbook Vol 1” by Dr. Kececioglu, Prentice-Hall, 1991.
Data
| Num. In Stage | State F or S | Time to Failure |
|---|---|---|
| 1 | F | 16 |
| 1 | F | 34 |
| 1 | F | 53 |
| 1 | F | 75 |
| 1 | F | 93 |
| 1 | F | 120 |
| 4 | S | 200 |
Results
| Num. In Stage | State F or S | Time to Failure | Median Rank (%) |
|---|---|---|---|
| 1 | F | 16 | 6.7 |
| 1 | F | 34 | 16.23 |
| 1 | F | 53 | 25.86 |
| 1 | F | 75 | 35.51 |
| 1 | F | 93 | 45.17 |
| 1 | F | 120 | 54.83 |
| 4 | S | 200 |
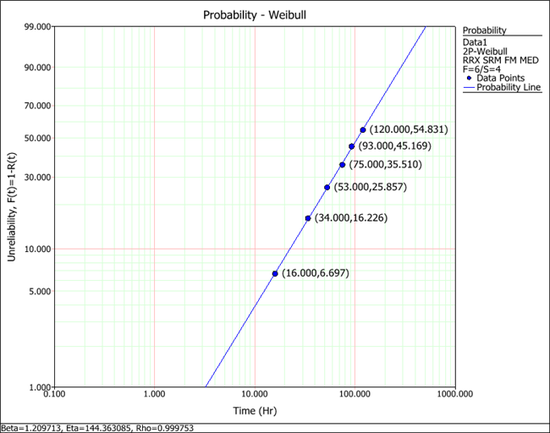
Results from Weibull++
The coordinates of each point in the following plot shows the failure time and the corresponding median rank.
