Plackett-Burman Design: Difference between revisions

From ReliaWiki
Jump to navigation Jump to search
No edit summary
No edit summary
Line 84: Line 84:


{{Reference_Example_Heading4|DOE++}}
Your text here.
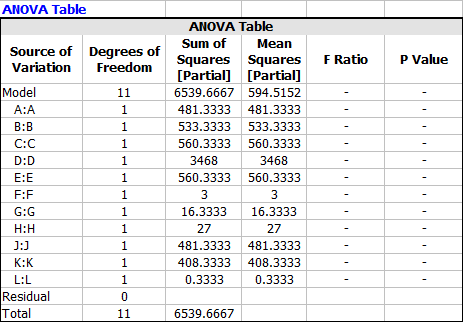
The software results match the book results. The ANOVA table is:
 
[[Image:plackett_burman_anova.png|center]]
.

Revision as of 15:40, 10 July 2015

DOE Reference Examples Banner.png


New format available! This reference is now available in a new format that offers faster page load, improved display for calculations and images and more targeted search.

As of January 2024, this Reliawiki page will not continue to be updated. Please update all links and bookmarks to the latest references at DOE examples and DOE reference examples.



Plackett-Burman Design

Validate the calculation of a Placket-Burman design.

Reference Case

Data is from Example 8-8 on page 346 in the book Design and Analysis of Experiments by Douglas C. Montgomery, John Wiley & Sons, 2001.

Data

Run A B C D E F G H J K L Response
1 -1 1 1 1 -1 -1 -1 1 -1 1 1 220
2 -1 1 1 -1 1 1 1 -1 -1 -1 1 207
3 -1 -1 1 -1 1 1 -1 1 1 1 -1 175
4 1 1 -1 -1 -1 1 -1 1 1 -1 1 185
5 -1 1 -1 1 1 -1 1 1 1 -1 -1 217
6 1 -1 1 1 1 -1 -1 -1 1 -1 1 229
7 1 -1 -1 -1 1 -1 1 1 -1 1 1 183
8 1 1 -1 1 1 1 -1 -1 -1 1 -1 231
9 1 -1 1 1 -1 1 1 1 -1 -1 -1 230
10 -1 -1 -1 -1 -1 -1 -1 -1 -1 -1 -1 168
11 -1 -1 -1 1 -1 1 1 -1 1 1 1 176
12 1 1 1 -1 -1 -1 1 -1 1 1 -1 181


Result From the book the ANOVA table is:

Variable Regression Coefficient Sum of Square
Overall Average 200.167
A 6.333 481.333
B 6.667 533.333
C 6.833 560.333
D 17.000 3468.000
E 6.833 560.333
F 0.500 3.000
G -1.167 16.333
H 1.500 27.000
J -6.333 481.333
K -5.833 408.333
J -0.167 0.333


Results in DOE++

The software results match the book results. The ANOVA table is:

Plackett burman anova.png

.