Sequential Data - Standard Gompertz Model: Difference between revisions
Jump to navigation
Jump to search
No edit summary |
Lisa Hacker (talk | contribs) No edit summary |
||
| Line 1: | Line 1: | ||
<noinclude>{{Banner RGA Examples}} | <noinclude>{{Banner RGA Examples}} | ||
''This example appears in the [ | ''This example appears in the [https://help.reliasoft.com/reference/reliability_growth_and_repairable_system_analysis Reliability growth reference]''. | ||
</noinclude> | </noinclude> | ||
Latest revision as of 21:20, 18 September 2023
 |
New format available! This reference is now available in a new format that offers faster page load, improved display for calculations and images and more targeted search.
As of January 2024, this Reliawiki page will not continue to be updated. Please update all links and bookmarks to the latest references at RGA examples and RGA reference examples.
This example appears in the Reliability growth reference.
Calculate the parameters of the Gompertz model using the sequential data in the following table.
| Run Number | Result | Successes | Observed Reliability(%) |
|---|---|---|---|
| 1 | F | 0 | |
| 2 | F | 0 | |
| 3 | F | 0 | |
| 4 | S | 1 | 25.00 |
| 5 | F | 1 | 20.00 |
| 6 | F | 1 | 16.67 |
| 7 | S | 2 | 28.57 |
| 8 | S | 3 | 37.50 |
| 9 | S | 4 | 44.44 |
| 10 | S | 5 | 50.00 |
| 11 | S | 6 | 54.55 |
| 12 | S | 7 | 58.33 |
| 13 | S | 8 | 61.54 |
| 14 | S | 9 | 64.29 |
| 15 | S | 10 | 66.67 |
| 16 | S | 11 | 68.75 |
| 17 | F | 11 | 64.71 |
| 18 | S | 12 | 66.67 |
| 19 | F | 12 | 63.16 |
| 20 | S | 13 | 65.00 |
| 21 | S | 14 | 66.67 |
| 22 | S | 15 | 68.18 |
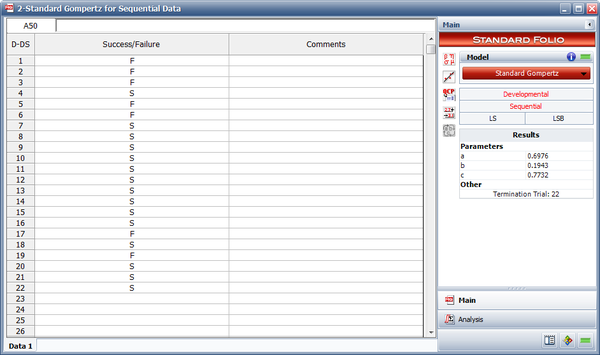
Solution
Using RGA, the parameter estimates are shown in the following figure.
