Sequential Data with Modes - Lloyd-Lipow Model: Difference between revisions
Jump to navigation
Jump to search
Sequential with Mode Data
mNo edit summary |
Lisa Hacker (talk | contribs) No edit summary |
||
| Line 1: | Line 1: | ||
<noinclude>{{Banner RGA Examples}} | <noinclude>{{Banner RGA Examples}} | ||
''This example appears in the [ | ''This example appears in the [https://help.reliasoft.com/reference/reliability_growth_and_repairable_system_analysis Reliability growth reference]''. | ||
</noinclude> | </noinclude> | ||
Latest revision as of 21:14, 18 September 2023
 |
New format available! This reference is now available in a new format that offers faster page load, improved display for calculations and images and more targeted search.
As of January 2024, this Reliawiki page will not continue to be updated. Please update all links and bookmarks to the latest references at RGA examples and RGA reference examples.
This example appears in the Reliability growth reference.
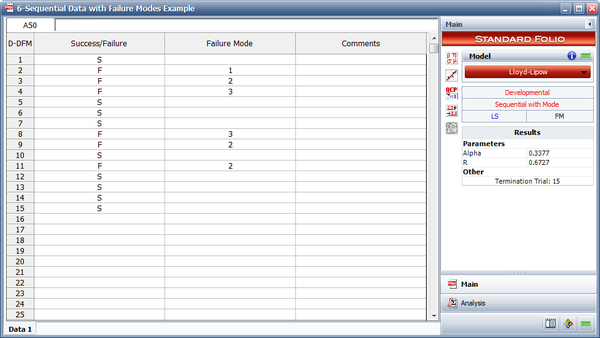
Use least squares to find the Lloyd-Lipow model that represents the data in the following table. This data set includes information about the failure mode that was responsible for each failure, so that the probability of each failure mode recurring is taken into account in the analysis.
| Run Number | Result | Mode |
|---|---|---|
| 1 | S | |
| 2 | F | 1 |
| 3 | F | 2 |
| 4 | F | 3 |
| 5 | S | |
| 6 | S | |
| 7 | S | |
| 8 | F | 3 |
| 9 | F | 2 |
| 10 | S | |
| 11 | F | 2 |
| 12 | S | |
| 13 | S | |
| 14 | S | |
| 15 | S |
Solution
The following figure shows the analysis.
