Uploads by Richard House
Jump to navigation
Jump to search
This special page shows all uploaded files.
| Date | Name | Thumbnail | Size | Description | Versions |
|---|---|---|---|---|---|
| 20:48, 5 January 2016 | Fig 5.9.PNG (file) |  |
56 KB | 2 | |
| 18:14, 30 January 2014 | Folio^E.png (file) |  |
17 KB | 2 | |
| 18:14, 30 January 2014 | Lastinspectedplot.png (file) |  |
28 KB | 3 | |
| 17:04, 31 January 2014 | Lda21.6.gif (file) |  |
55 KB | 4 | |
| 17:09, 31 January 2014 | Lda21.7.gif (file) |  |
41 KB | 2 | |
| 17:34, 31 January 2014 | Lda21 6 new.png (file) |  |
61 KB | 2 | |
| 17:28, 31 January 2014 | Lda21 7 new.png (file) |  |
31 KB | 1 | |
| 20:29, 30 January 2014 | Lda24.1.gif (file) |  |
29 KB | 2 | |
| 21:45, 30 January 2014 | Lda24 new.png (file) |  |
38 KB | 1 | |
| 19:53, 31 January 2014 | LdaappendixA 1 new.png (file) |  |
5 KB | 1 | |
| 19:57, 31 January 2014 | LdaappendixA 2 new.png (file) |  |
5 KB | 1 | |
| 21:55, 11 December 2015 | Load Share model FT.png (file) |  |
61 KB | 1 | |
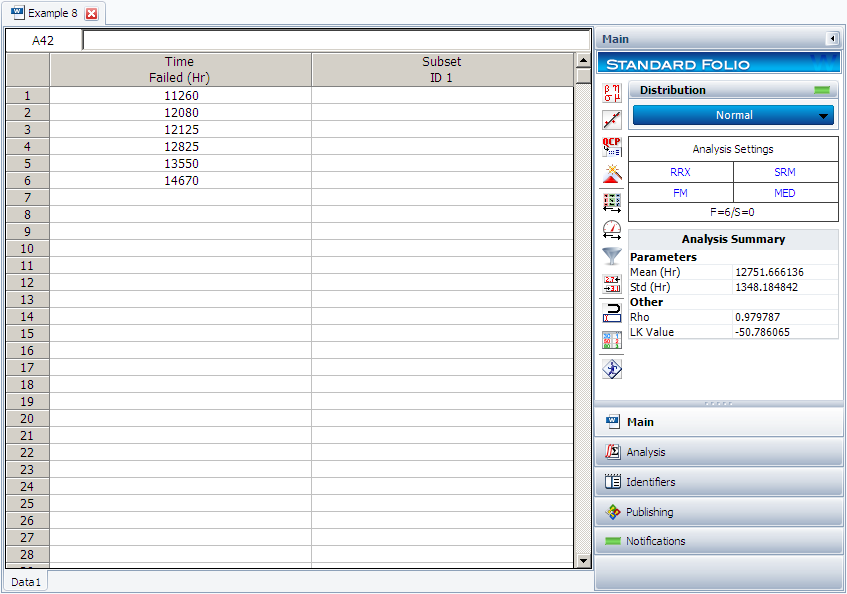
| 18:12, 30 January 2014 | Normal Distribution Example 8 Data.png (file) |  |
42 KB | 2 | |
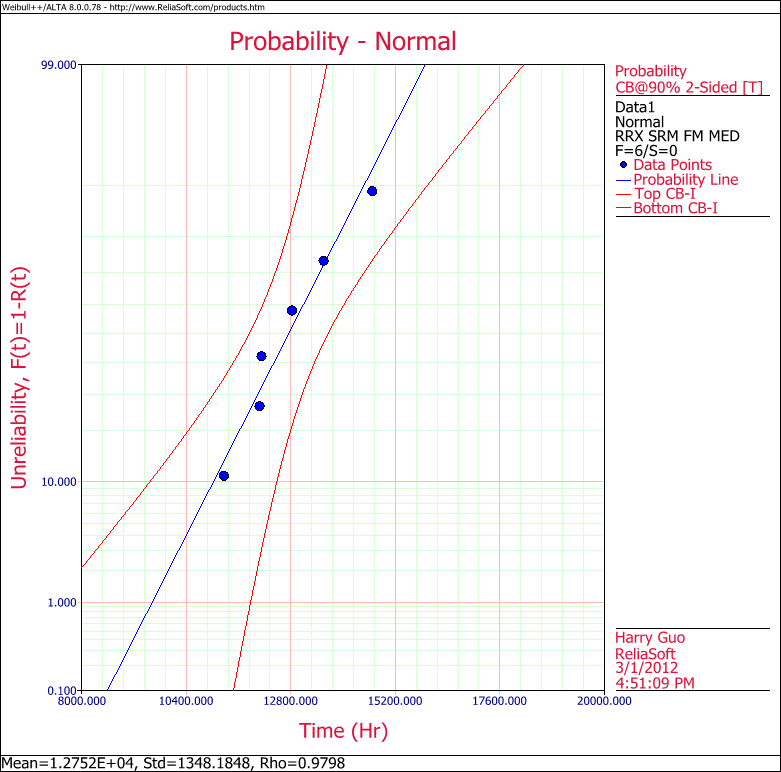
| 18:12, 30 January 2014 | Normal Distribution Example 8 Probability Plot.png (file) |  |
29 KB | 2 | |
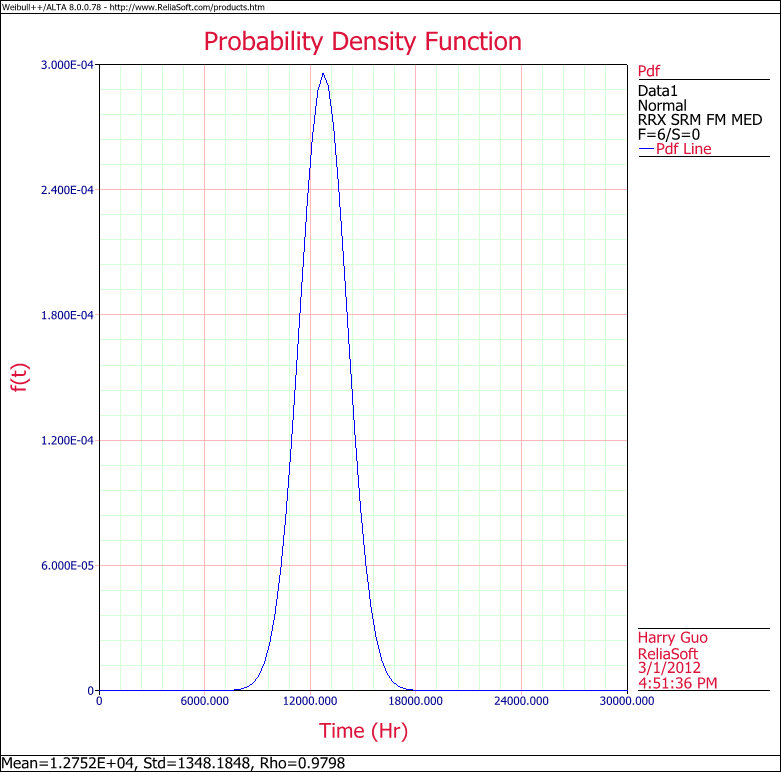
| 18:12, 30 January 2014 | Normal Distribution Example 8 pdf Plot.png (file) |  |
22 KB | 2 | |
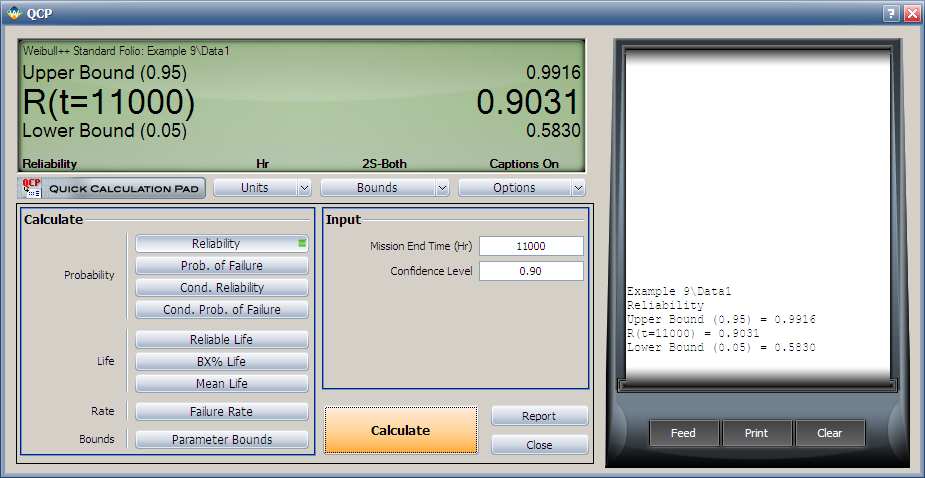
| 18:13, 30 January 2014 | Normal Distribution Example 9 QCP 1.png (file) |  |
88 KB | 2 | |
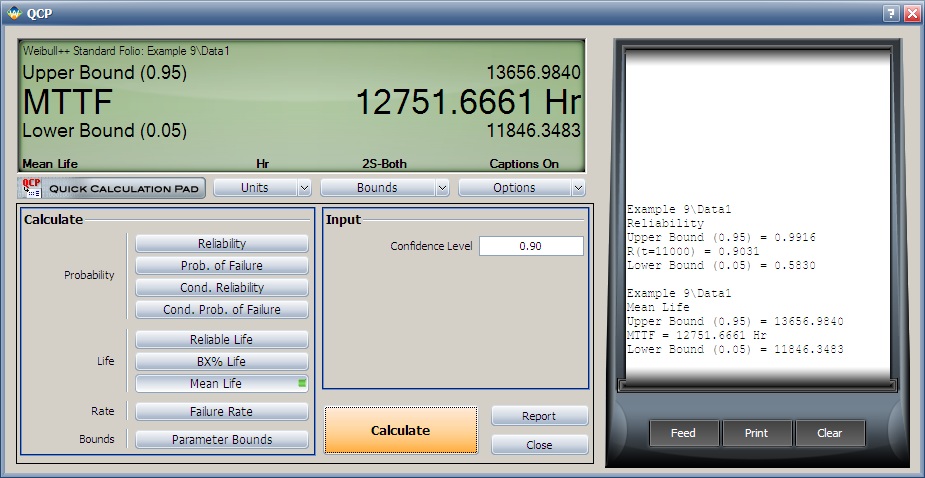
| 18:13, 30 January 2014 | Normal Distribution Example 9 QCP 2.png (file) |  |
90 KB | 2 | |
| 18:08, 30 January 2014 | Normal MLE Plot.png (file) |  |
47 KB | 2 | |
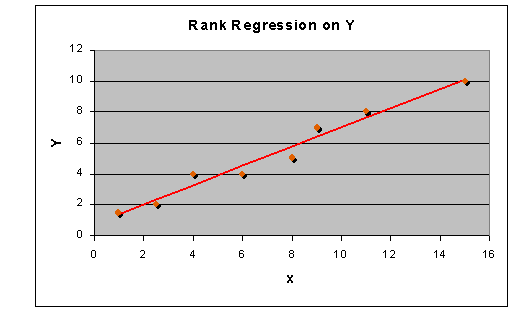
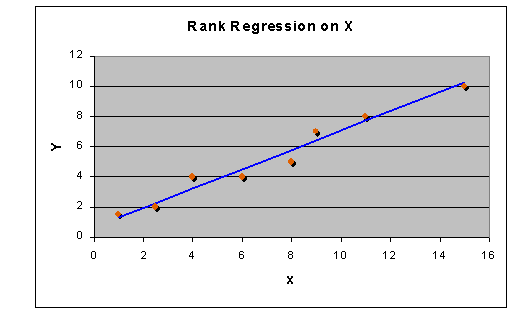
| 18:07, 30 January 2014 | Normal RRX Plot.png (file) |  |
46 KB | 2 | |
| 18:07, 30 January 2014 | Normal RRY Plot.png (file) |  |
46 KB | 2 | |
| 18:07, 30 January 2014 | Normal RRY Setting.png (file) |  |
41 KB | 2 | |
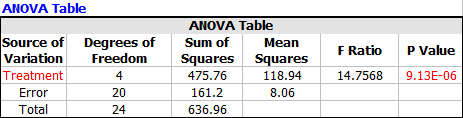
| 19:16, 31 July 2015 | One factor anova.png (file) | 5 KB | 2 | ||
| 21:51, 8 July 2015 | Plackett burman anova.png (file) |  |
11 KB | 1 | |
| 21:51, 8 July 2015 | Plackett burman equation.png (file) |  |
5 KB | 1 | |
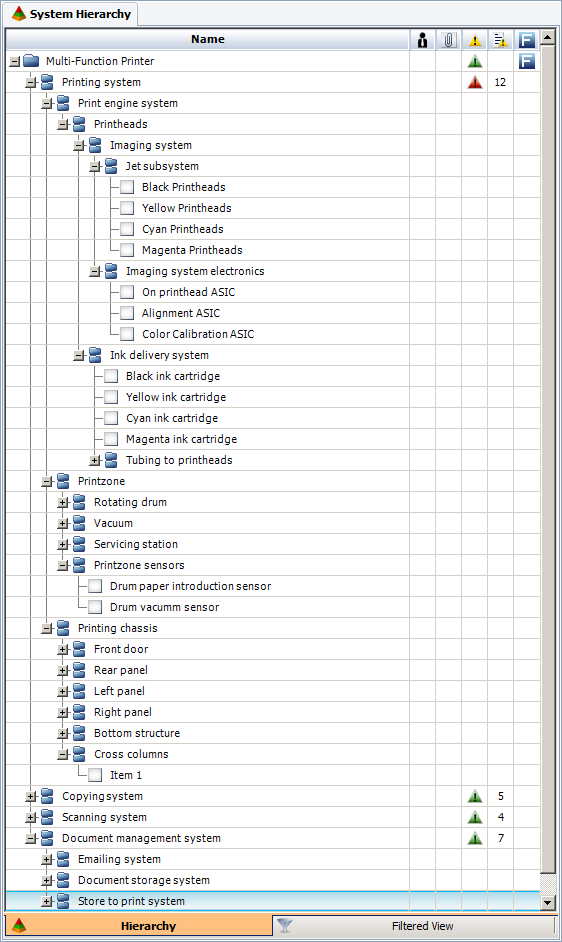
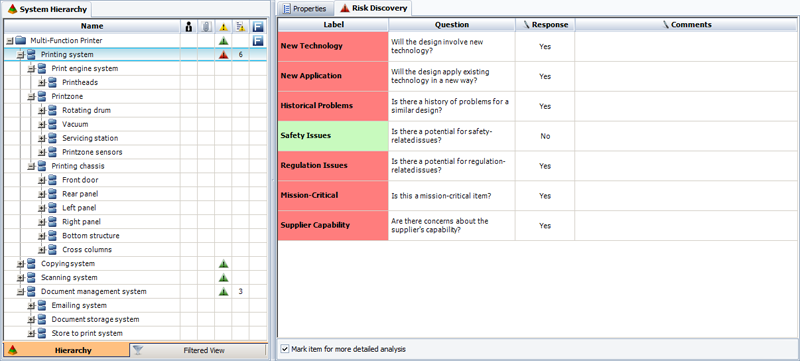
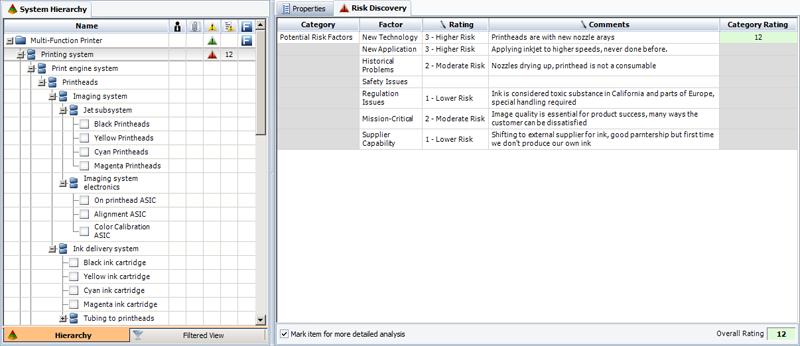
| 18:03, 18 October 2016 | Printer System for FMEA Example.png (file) |  |
56 KB | 2 | |
| 18:05, 18 October 2016 | Printer System for FMEA Example 1.png (file) |  |
101 KB | 2 | |
| 18:06, 18 October 2016 | Printer System for FMEA Example 2.png (file) |  |
110 KB | 2 | |
| 18:19, 6 January 2016 | R23.png (file) |  |
50 KB | 2 | |
| 18:37, 6 January 2016 | R25.png (file) |  |
49 KB | 2 | |
| 17:29, 11 December 2015 | R29.png (file) |  |
76 KB | 1 | |
| 17:28, 11 December 2015 | R29b.png (file) |  |
78 KB | 1 | |
| 17:34, 11 December 2015 | R30.png (file) |  |
78 KB | 1 | |
| 20:18, 3 February 2014 | R5 new.png (file) |  |
86 KB | 1 | |
| 21:51, 8 July 2015 | Reliability doe mle info.png (file) |  |
12 KB | 1 | |
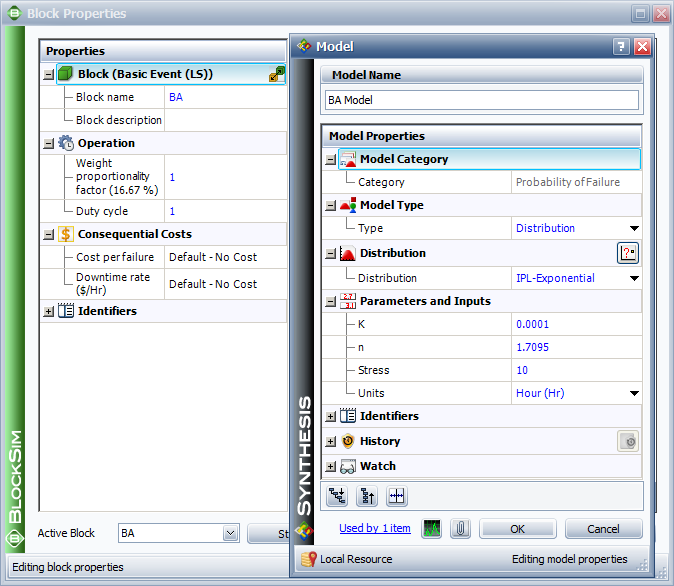
| 18:36, 11 December 2015 | RepairDistributionBlockProperties.png (file) |  |
109 KB | 1 | |
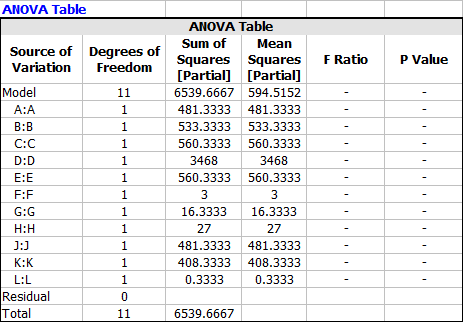
| 21:51, 8 July 2015 | Robust design anova.png (file) |  |
11 KB | 1 | |
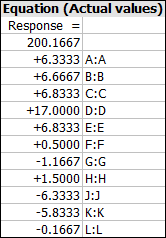
| 21:51, 8 July 2015 | Robust design equation.png (file) |  |
6 KB | 1 | |
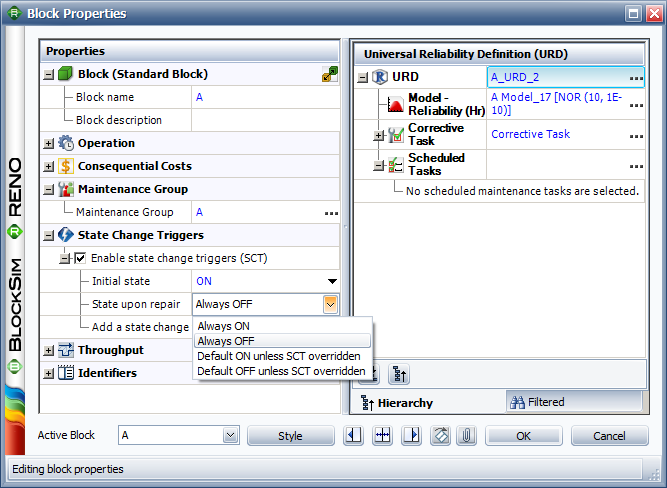
| 20:13, 6 January 2016 | State Change Trigger Options.png (file) |  |
58 KB | 2 | |
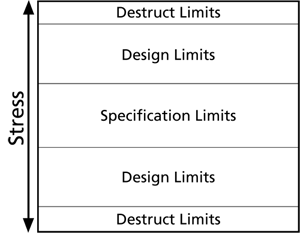
| 17:34, 5 February 2014 | Stress-Limits whitetest.png (file) |  |
16 KB | 2 | |
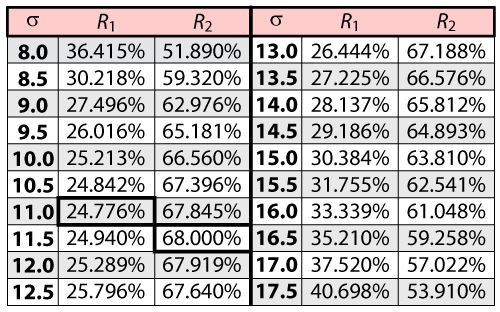
| 18:11, 30 January 2014 | Tablerbasedonsigma.png (file) |  |
44 KB | 2 | |
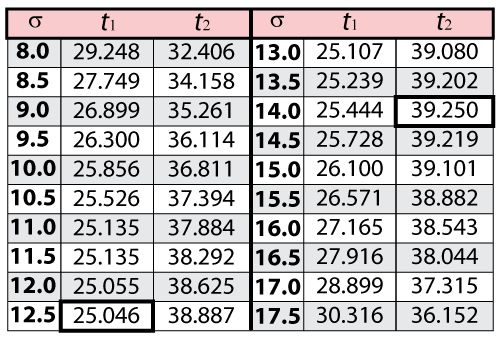
| 18:10, 30 January 2014 | Tabletbasedonsigma.png (file) |  |
39 KB | 2 | |
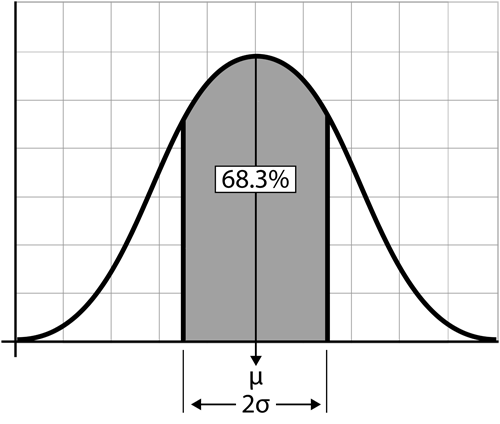
| 18:05, 30 January 2014 | WB.9 68.3.png (file) |  |
22 KB | 2 | |
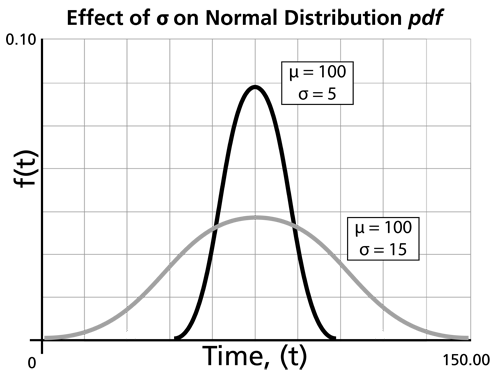
| 18:04, 30 January 2014 | WB.9 effect of sigma.png (file) |  |
34 KB | 2 | |
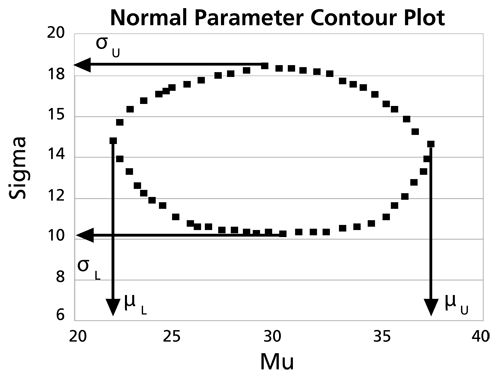
| 18:09, 30 January 2014 | WB.9 normal parameter contour plot.png (file) |  |
21 KB | 2 | |
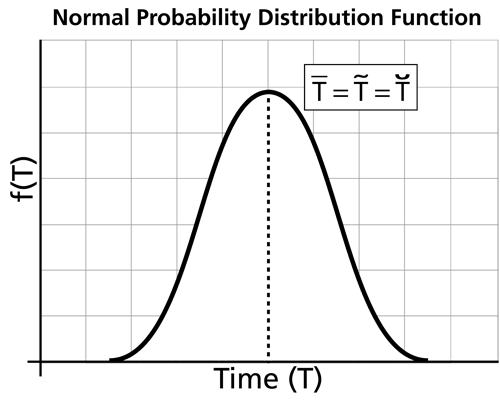
| 18:04, 30 January 2014 | WB.9 normalpdf.png (file) |  |
37 KB | 2 | |
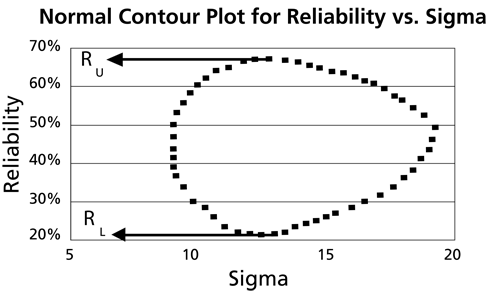
| 18:11, 30 January 2014 | WB.9 reliability v sigma.png (file) |  |
23 KB | 2 | |
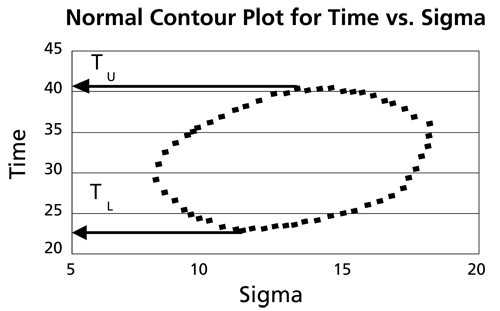
| 18:10, 30 January 2014 | WB.9 time v sigma contour.png (file) |  |
20 KB | 2 | |
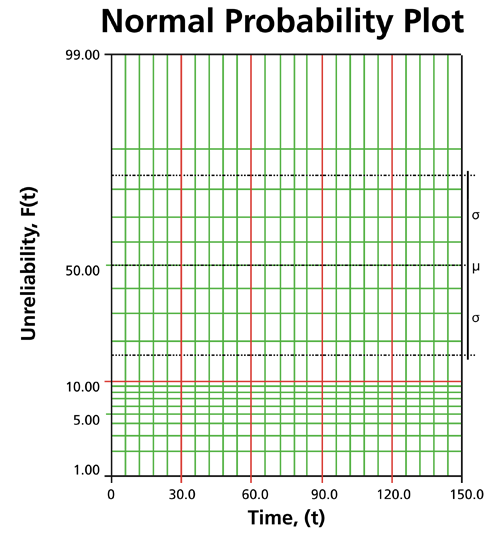
| 18:05, 30 January 2014 | WB.9normalPP.png (file) |  |
62 KB | 2 | |
| 21:36, 6 November 2012 | Webnotesbanner-MPC.png (file) |  |
9 KB | 1 | |
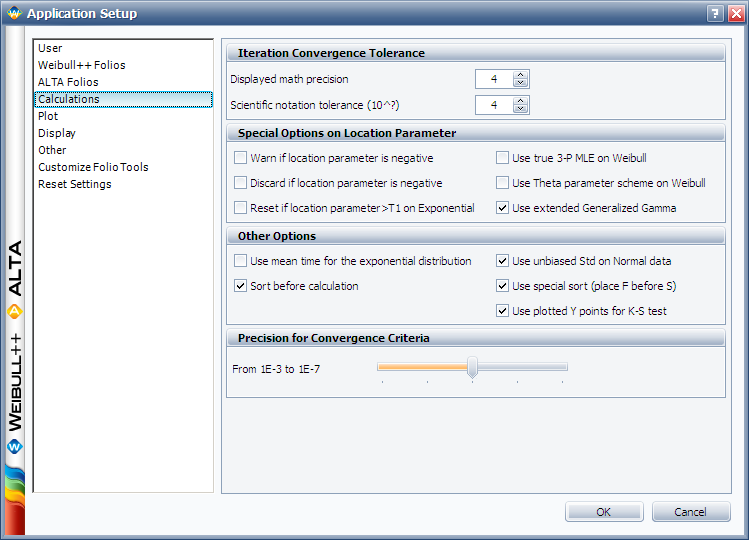
| 18:08, 30 January 2014 | Weibull Calculation User Setting.png (file) |  |
34 KB | 2 |