Uploads by Dingzhou Cao
Jump to navigation
Jump to search
This special page shows all uploaded files.
| Date | Name | Thumbnail | Size | Description | Versions |
|---|---|---|---|---|---|
| 23:46, 7 February 2012 | 10.26.gif (file) |  |
151 KB | 1 | |
| 23:49, 7 February 2012 | 10.27.gif (file) |  |
150 KB | 1 | |
| 23:52, 7 February 2012 | 10.28.gif (file) |  |
151 KB | 2 | |
| 18:26, 8 February 2012 | 10.34.gif (file) |  |
198 KB | 1 | |
| 23:08, 7 February 2012 | 10.8.gif (file) |  |
265 KB | 1 | |
| 15:56, 6 February 2012 | 11.1.gif (file) |  |
40 KB | 2 | |
| 17:30, 7 February 2012 | 11.15.gif (file) |  |
6 KB | 2 | |
| 21:42, 7 February 2012 | 11.20.gif (file) |  |
22 KB | 2 | |
| 21:51, 7 February 2012 | 11.21.gif (file) |  |
6 KB | 2 | |
| 23:28, 6 February 2012 | 11.3.gif (file) |  |
98 KB | 2 | |
| 23:34, 6 February 2012 | 11.4.gif (file) |  |
90 KB | 5 | |
| 16:14, 26 November 2012 | 6.15.png (file) |  |
8 KB | 1 | |
| 23:19, 28 February 2012 | 8.14.gif (file) |  |
256 KB | 1 | |
| 17:36, 10 February 2012 | 8.15.gif (file) |  |
129 KB | 2 | |
| 17:39, 10 February 2012 | 8.16.gif (file) |  |
90 KB | 1 | |
| 20:37, 9 February 2012 | 8.7.gif (file) |  |
137 KB | 1 | |
| 21:14, 8 February 2012 | 9.10.gif (file) |  |
91 KB | 1 | |
| 21:22, 8 February 2012 | 9.11.gif (file) |  |
124 KB | 1 | |
| 21:26, 8 February 2012 | 9.12.gif (file) |  |
116 KB | 1 | |
| 21:26, 8 February 2012 | 9.13.gif (file) |  |
116 KB | 2 | |
| 22:54, 8 February 2012 | 9.19.gif (file) |  |
131 KB | 2 | |
| 22:48, 8 February 2012 | 9.20.gif (file) |  |
27 KB | 1 | |
| 23:07, 8 February 2012 | 9.21.2.gif (file) |  |
13 KB | 1 | |
| 22:52, 8 February 2012 | 9.21.gif (file) |  |
20 KB | 1 | |
| 20:28, 8 February 2012 | 9.4.gif (file) |  |
97 KB | 3 | |
| 18:12, 8 March 2012 | AND gate.png (file) |  |
36 KB | 1 | |
| 16:51, 19 March 2012 | Anlytical FRED example.png (file) |  |
7 KB | 1 | |
| 22:44, 19 March 2012 | BS4-30.png (file) |  |
41 KB | 1 | |
| 22:14, 28 February 2012 | BS6.18.png (file) |  |
39 KB | 1 | |
| 22:03, 9 February 2012 | BS8.10.png (file) |  |
103 KB | 1 | |
| 18:03, 10 February 2012 | BS8.18.png (file) |  |
72 KB | 1 | |
| 18:14, 10 February 2012 | BS8.19.png (file) |  |
81 KB | 1 | |
| 18:44, 10 February 2012 | BS8.23.png (file) |  |
83 KB | 2 | |
| 20:52, 8 March 2012 | Block Failure Rate.png (file) |  |
66 KB | 1 | |
| 20:51, 8 March 2012 | Block Probability Density Function.png (file) |  |
67 KB | 1 | |
| 20:47, 8 March 2012 | Block Reliability vs. Time.png (file) |  |
70 KB | 1 | |
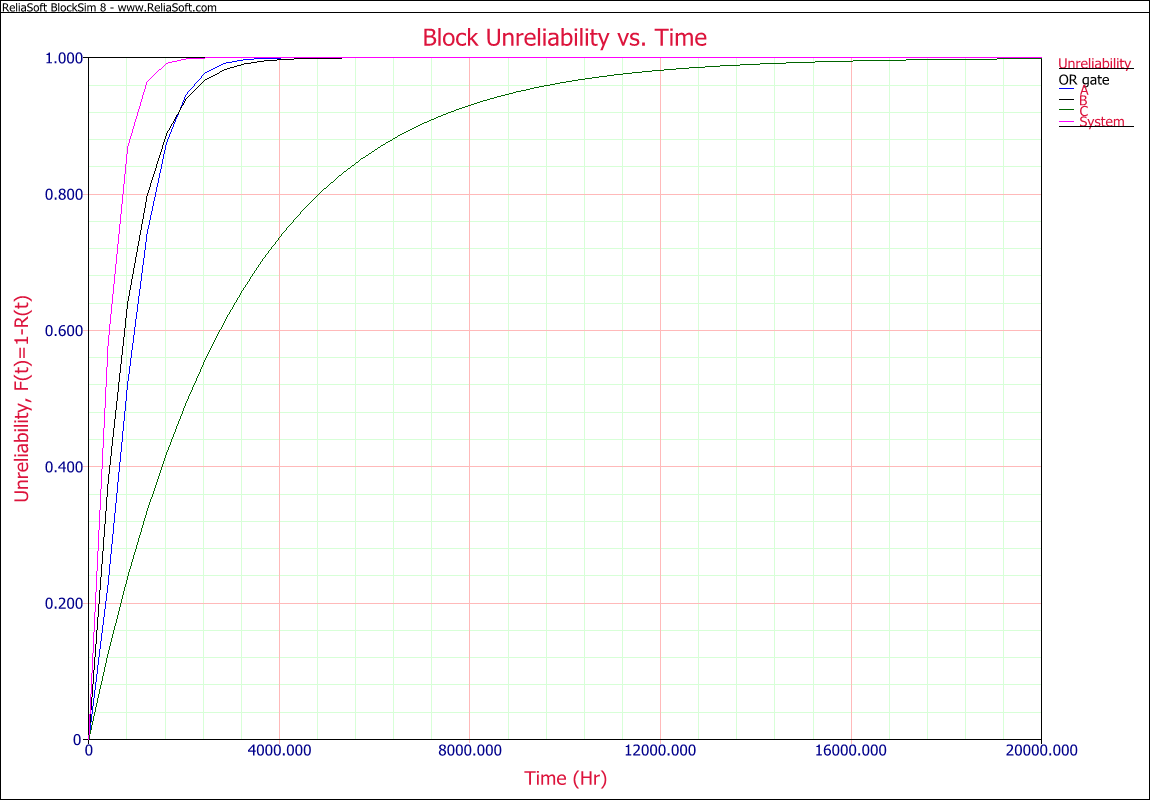
| 20:46, 8 March 2012 | Block Unreliability vs. Time.png (file) |  |
68 KB | 1 | |
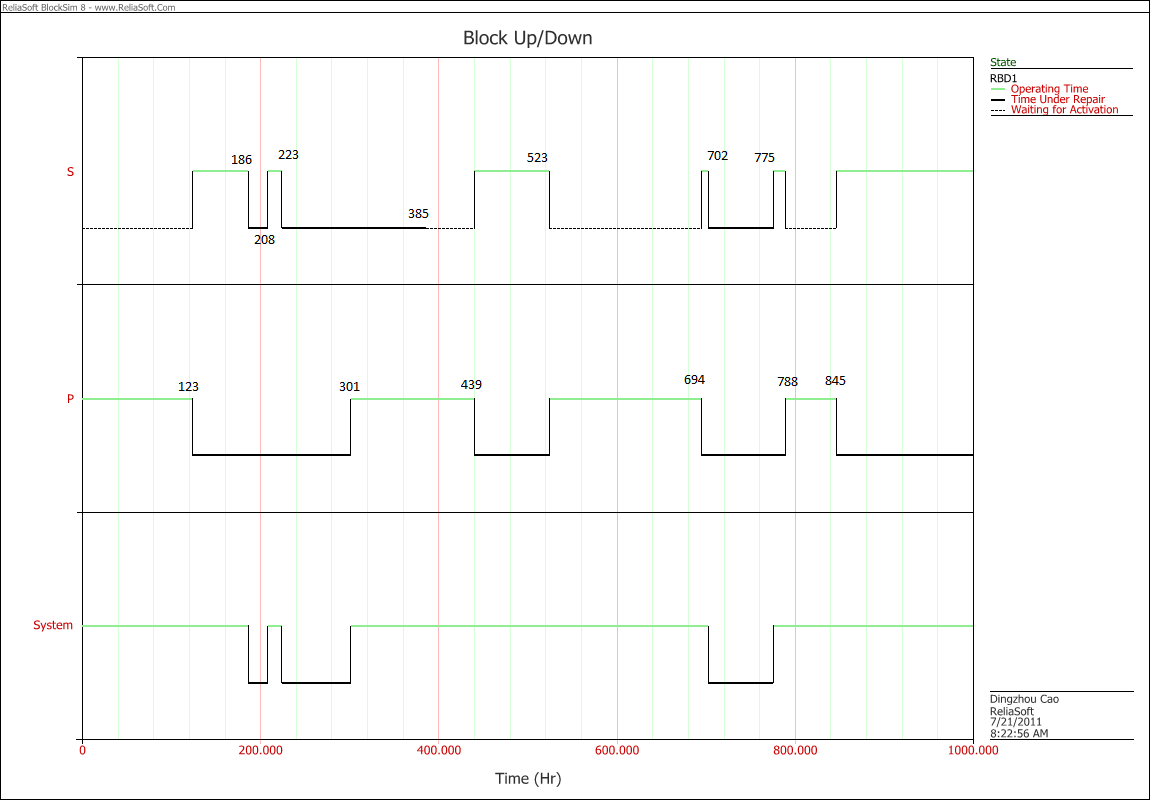
| 18:14, 21 July 2011 | Block up down plot for default OFF unless SCT overridden example.png (file) |  |
47 KB | 1 | |
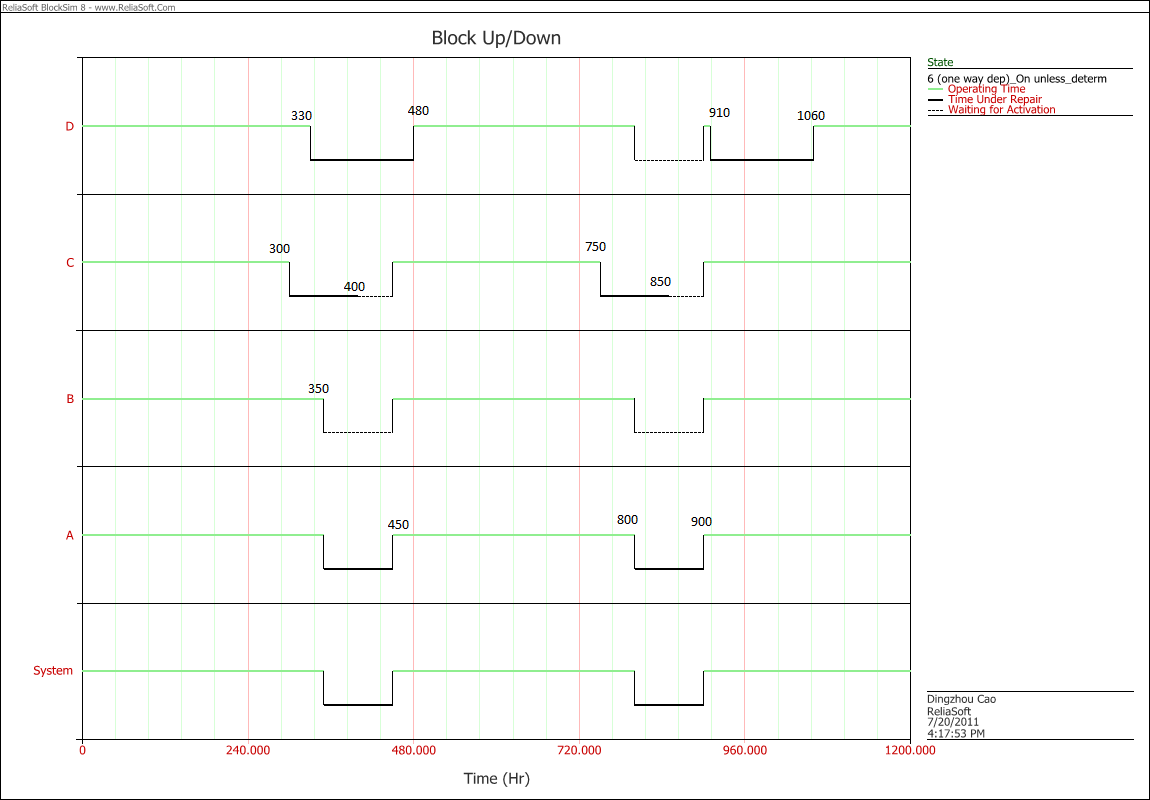
| 01:32, 21 July 2011 | Block up down plot for one way dependence example.png (file) |  |
44 KB | 1 | |
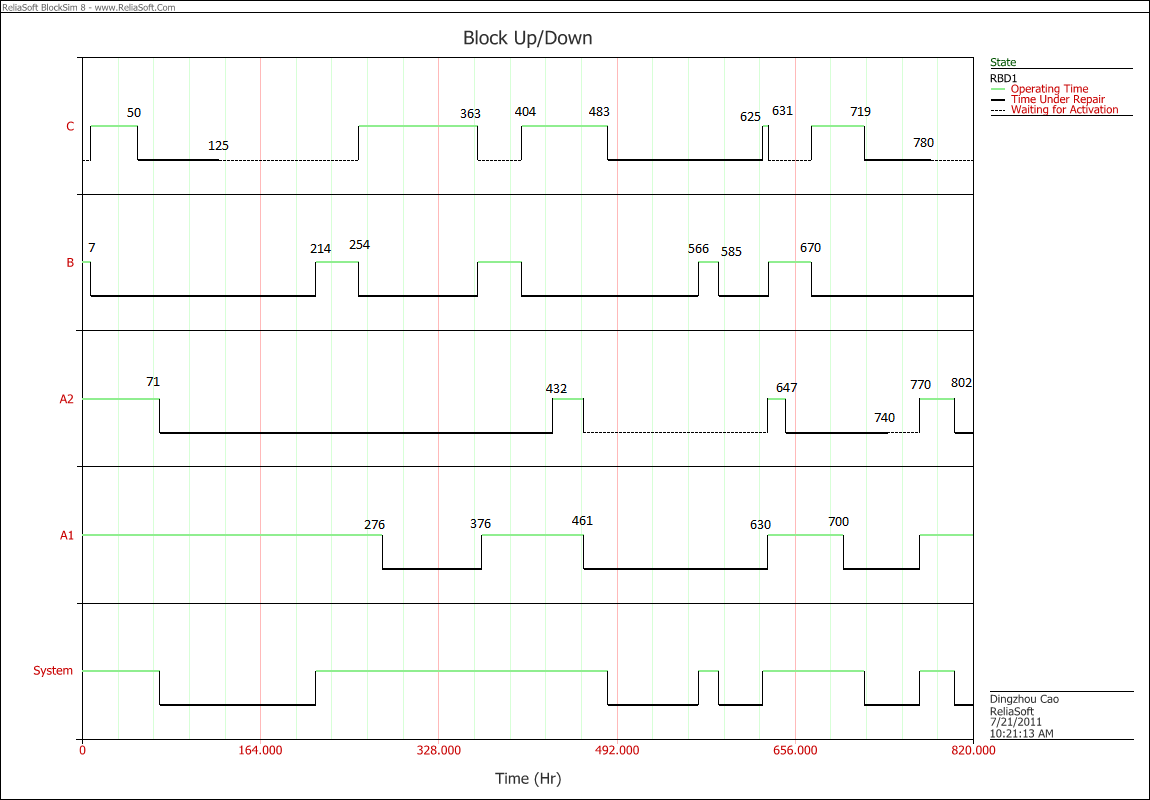
| 15:52, 21 July 2011 | Block up down plot for primary and standby example.png (file) |  |
42 KB | 1 | |
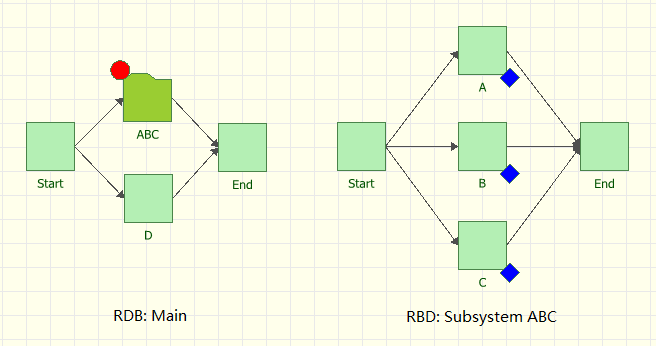
| 21:04, 30 August 2011 | CM triggered by subsystem down (subdiagram solution) Main.png (file) | _Main.png) |
15 KB | 1 | |
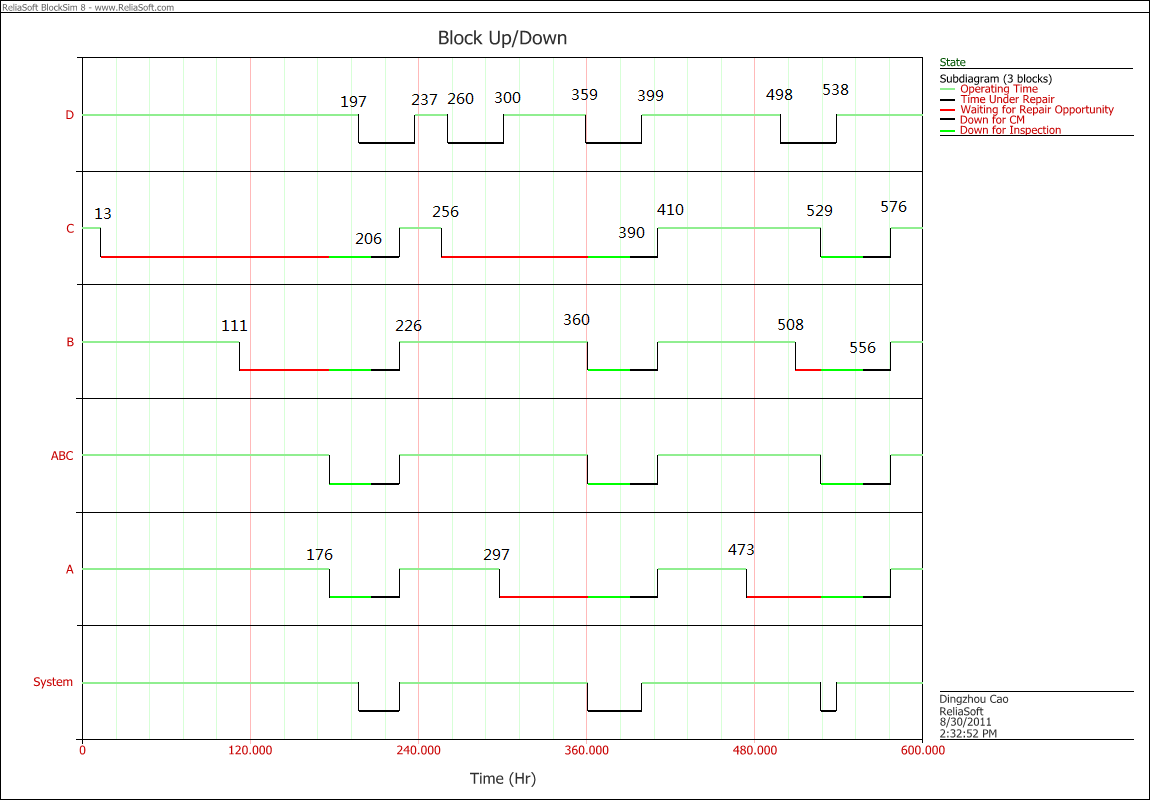
| 21:51, 30 August 2011 | CM triggered by subsystem down (subdiagram solution) Up Down plot.png (file) | _Up_Down_plot.png) |
53 KB | 1 | |
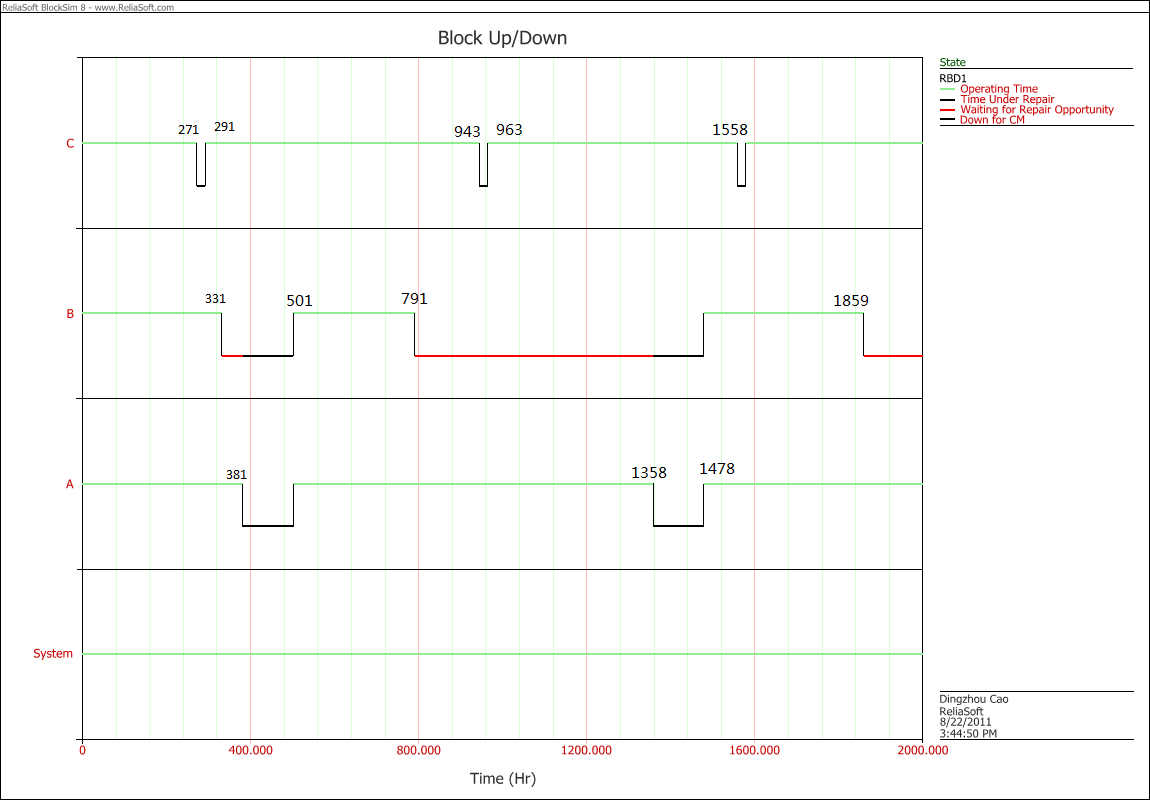
| 22:56, 22 August 2011 | CM triggered by susbystem failure Up Down plot.png (file) |  |
44 KB | 1 | |
| 17:30, 21 July 2011 | Default OFF unless SCT overridden.png (file) |  |
9 KB | 2 | |
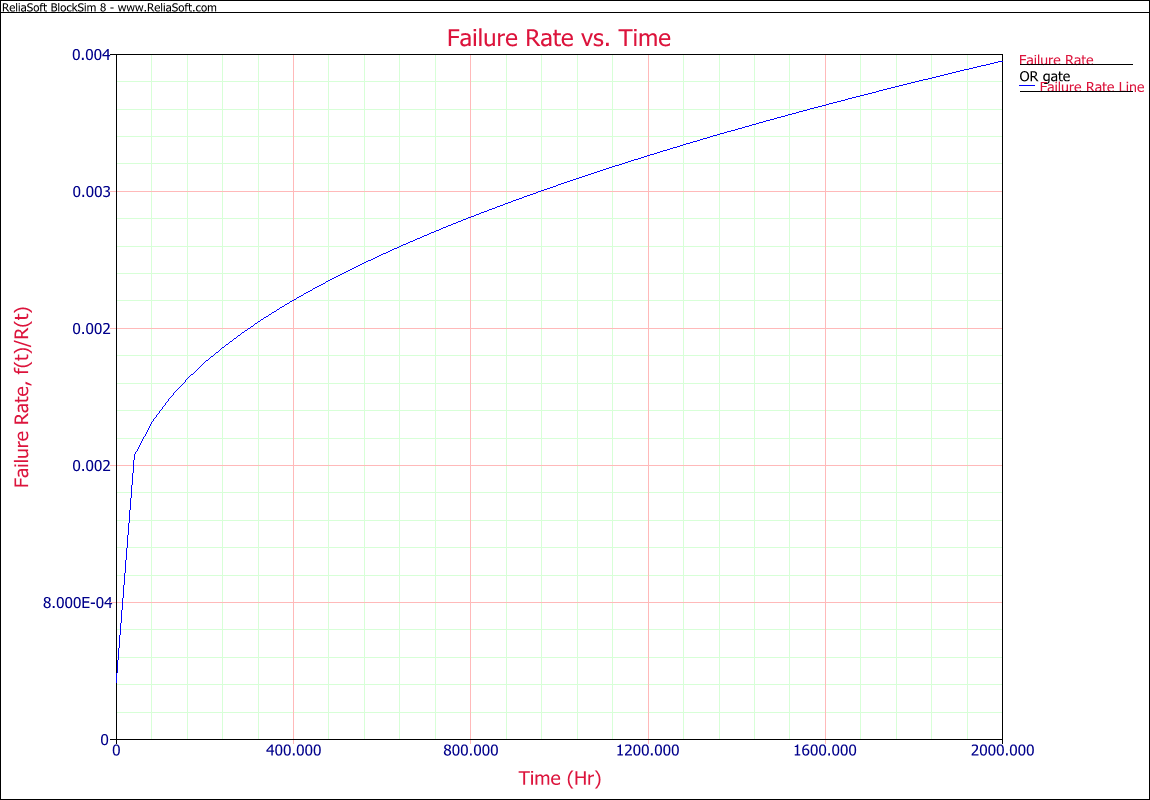
| 20:33, 8 March 2012 | Failure Rate VS Time.png (file) |  |
64 KB | 1 | |
| 15:46, 6 March 2012 | Fig 5.23 2.PNG (file) |  |
49 KB | 2 | |
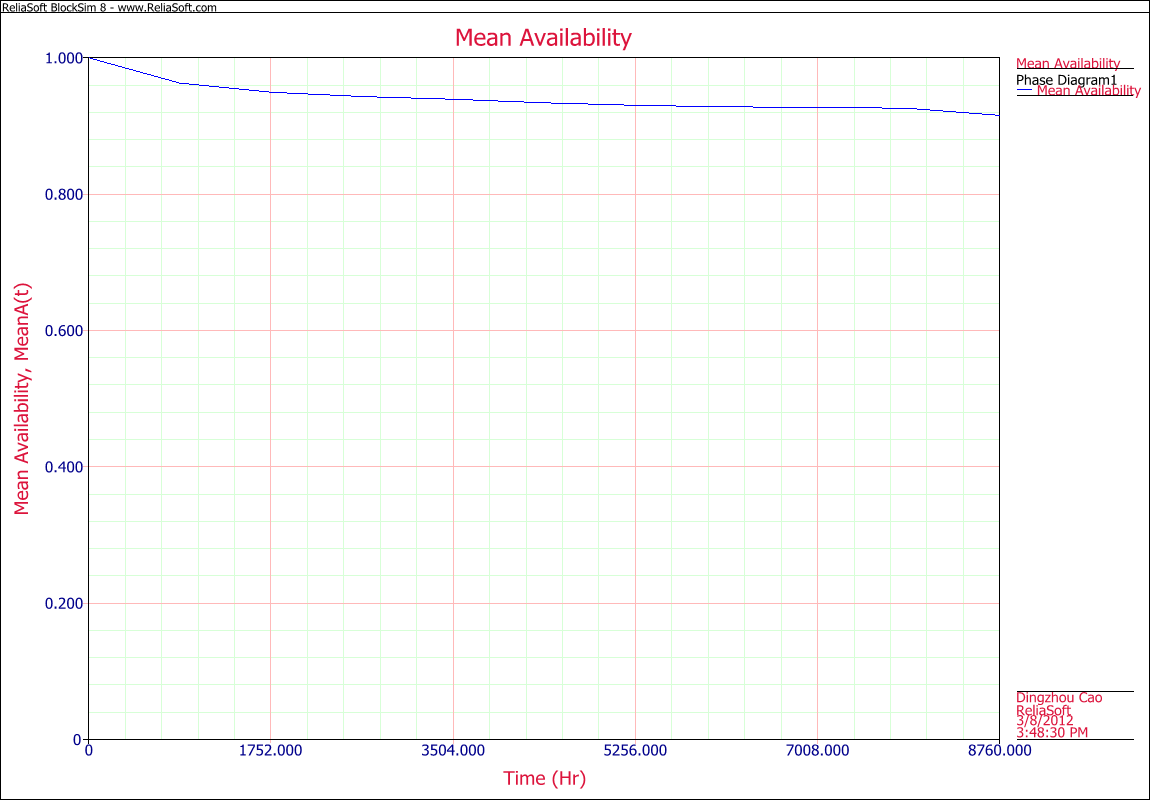
| 22:58, 8 March 2012 | Mean Availability.png (file) |  |
70 KB | 2 | |
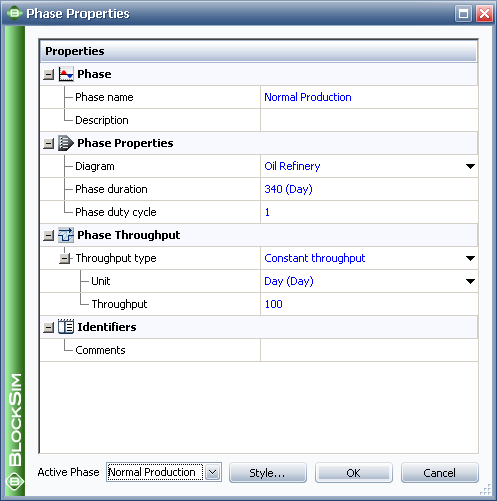
| 21:59, 8 March 2012 | Nornal Production phase properties for oil refinery.png (file) |  |
23 KB | 1 | |
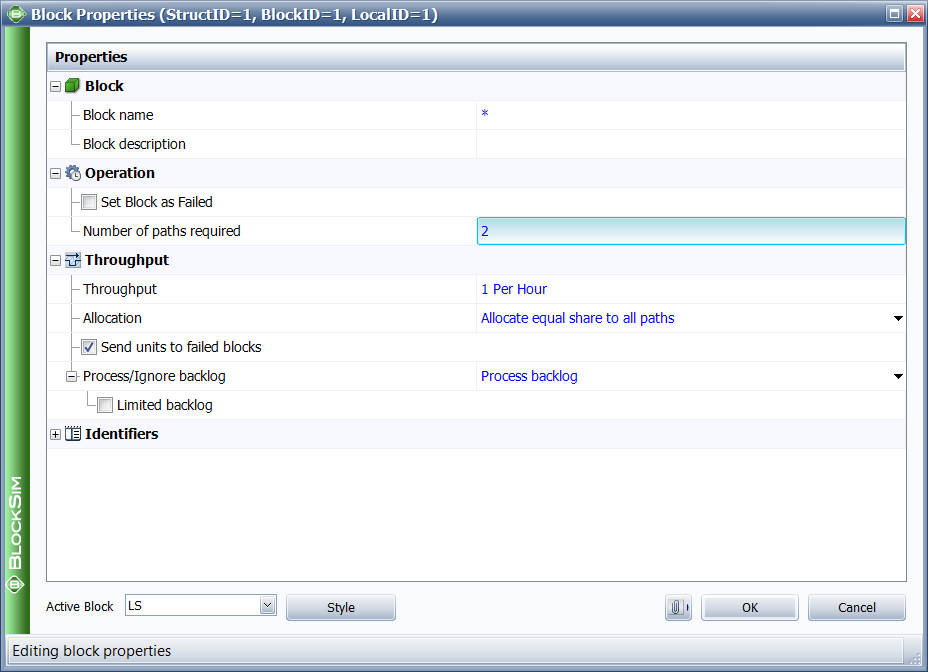
| 18:08, 8 March 2012 | OR gate.png (file) |  |
32 KB | 1 | |
| 18:47, 8 March 2012 | OR gate Results.png (file) |  |
12 KB | 1 |