Stress-Strength Analysis in Design for Reliability: Difference between revisions
No edit summary |
Lisa Hacker (talk | contribs) No edit summary |
||
| Line 1: | Line 1: | ||
'''Stress-Strength Analysis | '''Determining the Strength Distribution for a Stress-Strength Analysis''' | ||
Assume the stress distribution for a component is known and it is a Weibull distribution with beta=3 | Assume the stress distribution for a component is known and it is a Weibull distribution with beta=3 and eta=2000. For the current design, the strength distribution is also a Weibull distribution with beta =1.5 and eta=4000. | ||
:*Evaluate the current reliability. | :*Evaluate the current reliability. | ||
Revision as of 18:39, 30 March 2012
Determining the Strength Distribution for a Stress-Strength Analysis
Assume the stress distribution for a component is known and it is a Weibull distribution with beta=3 and eta=2000. For the current design, the strength distribution is also a Weibull distribution with beta =1.5 and eta=4000.
- Evaluate the current reliability.
- If the reliability does not meet the target reliability of 90%, please use the Target Reliability Parameter Estimator to determine what parameters would be required for the strength distribution in order to meet the specified target.
Solution
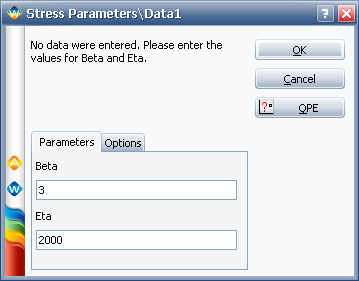
First, we need create two empty Weibull++ standard folio and enter the distribution parameters for the stress and strenght distribution. For example, for the stress distribution, it is:
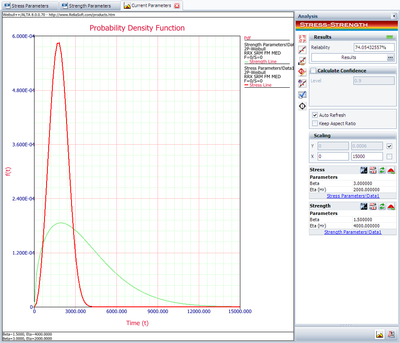
Then, following the steps given in Example 1, the reliability of the current design is given in the following figure:
The above result shows that the current reliability is about 74.05% which is below the target value of 90%. We need to use the Target Reliability Parameter Estimator to determine the distribution parameter for the strength distribution. Click on the following icon:
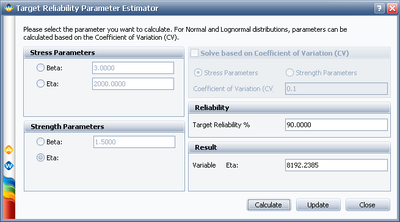
Choose to calculate for Eta under Strength Parameters, set the Target Reliability to 90%, and click Calculate:
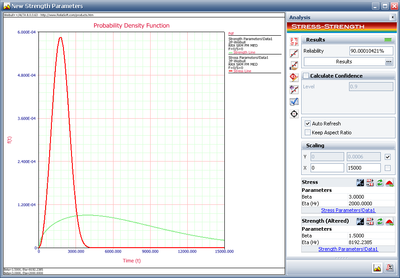
The calculated eta is 8192.2385. Click Update to perform the stress-strength analysis again using the altered parameters for the strength distribution.
The plot shows the calculated reliability indeed is 90%.
Therefore, in order to meet the reliability requirement, the component must to be redesigned with the eta to be at least of 8192.2385.


