Template:Aaw rf: Difference between revisions
Jump to navigation
Jump to search
![Reliability function for [math]\displaystyle{ \Beta\lt 1 }[/math], [math]\displaystyle{ \Beta=1 }[/math], and [math]\displaystyle{ \Beta\gt 1 }[/math].](/images/thumb/b/bb/ALTA6.8.png/250px-ALTA6.8.png)
Chuck Smith (talk | contribs) |
|||
| Line 9: | Line 9: | ||
If the parameter <math>B</math> is positive, then the reliability increases as stress decreases. | If the parameter <math>B</math> is positive, then the reliability increases as stress decreases. | ||
<br> | <br> | ||
[[Image:ALTA6.7.png|center| | [[Image:ALTA6.7.png|center|250px|Behavior of the reliability function at different stress and constant parameter values.]] | ||
<br> | <br> | ||
| Line 19: | Line 19: | ||
<br> | <br> | ||
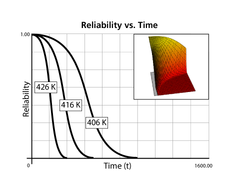
[[Image:ALTA6.8.png|center| | [[Image:ALTA6.8.png|center|250px|Reliability function for <math>\Beta<1 </math>, <math>\Beta=1 </math>, and <math>\Beta>1 </math>.]] | ||
<br> | <br> | ||
Revision as of 15:59, 26 April 2012
Arrhenius-Weibull Reliability Function
The Arrhenius-Weibull reliability function is given by:
- [math]\displaystyle{ R(T,V)={{e}^{-{{\left( \tfrac{T}{C\cdot {{e}^{\tfrac{B}{V}}}} \right)}^{\beta }}}} }[/math]
If the parameter [math]\displaystyle{ B }[/math] is positive, then the reliability increases as stress decreases.

The behavior of the reliability function of the Weibull distribution for different values of [math]\displaystyle{ \beta }[/math] was illustrated here. In the case of the Arrhenius-Weibull model, however, the reliability is a function of stress also. A 3D plot such as the ones shown in the next figure is now needed to illustrate the effects of both the stress and [math]\displaystyle{ \beta . }[/math]
- [math]\displaystyle{ }[/math]
![Reliability function for [math]\displaystyle{ \Beta\lt 1 }[/math], [math]\displaystyle{ \Beta=1 }[/math], and [math]\displaystyle{ \Beta\gt 1 }[/math].](/index.php/File:ALTA6.8.png)