Template:BlockSim Analytical FRED Report Example
You can use the analytical results and maintainability/availability simulation results for your BlockSim diagrams and fault trees to generate Failure Reporting, Evaluating and Display (FRED) Reports. These reports provide a graphical demonstration of the reliability and maintainability/availability characteristics of the components in a system and help to identify the components that may require improvement.
Analytical FRED reports illustrate the reliability characteristics of a system’s components in a flexible, color-coded format.
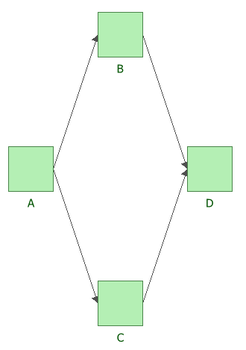
For example, consider a analytical diagram like this:
Block A with Weibull(Beta=1.5, Eta=1000), Block B with Weibull(Beta=1.5, Eta=700), Block C with Weibull(Beta=1.5, Eta=600) and Block D with Weibull(Beta=1.5, Eta=900).
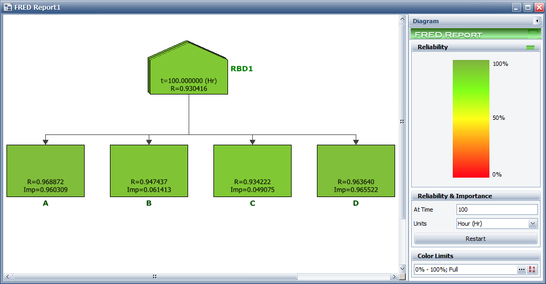
The FRED reports for this diagram looks like this:
The pentagon-shaped block in the first row represents the reliability results for the first diagram included in the analytical FRED report.
- t displays the time at which the reliability is reported for the system and its blocks and at which time the importance factor is reported for the blocks. You set the time in the At Time field in the control panel.
- R displays the reliability of the block at time t.
- Imp displays the reliability importance of the block at time t.
While two blocks may have the same reliability, their importance factors may differ because of their positions within the RBD. For example, a block in a series configuration may have a greater importance factor than a block in a parallel configuration, because any failure of the block in the series configuration will bring the system down.

