Template:BlockSim Overlay Plot Example
Jump to navigation
Jump to search
Overlay Plot
BlockSim gives you the ability to place results from more than one RBD, fault tree and/or phase diagram on a single plot using an overlay plot. You must have two or more analyzed diagrams, fault trees and/or phase diagrams within the current project in order to plot multiple diagrams in an overlay plot diagram.
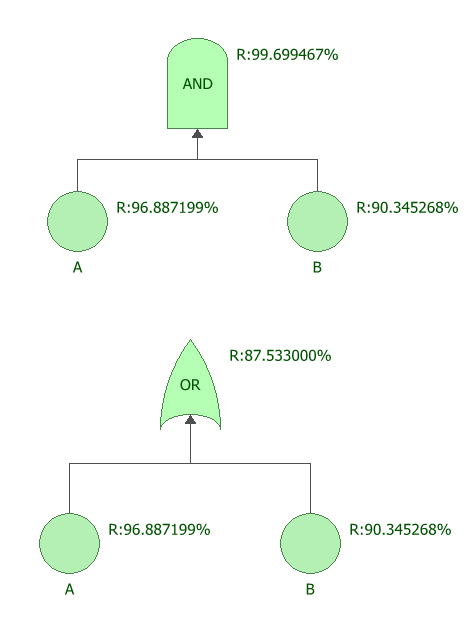
Consider two component A and B, with Weibull(Beta=1.5, Eta=1000) and Weibull(Beta=1.1, Eta=800) respectively. Next we will use overlay plot to plot their results in one plot.
With mission time as 100 hours, the reliability of OR gate and AND gate are show in the figures below.
