Template:Example:GER: Difference between revisions
Jump to navigation
Jump to search
Chris Kahn (talk | contribs) |
|||
| Line 1: | Line 1: | ||
==Generalized Eyring Example== | ==Generalized Eyring Example== | ||
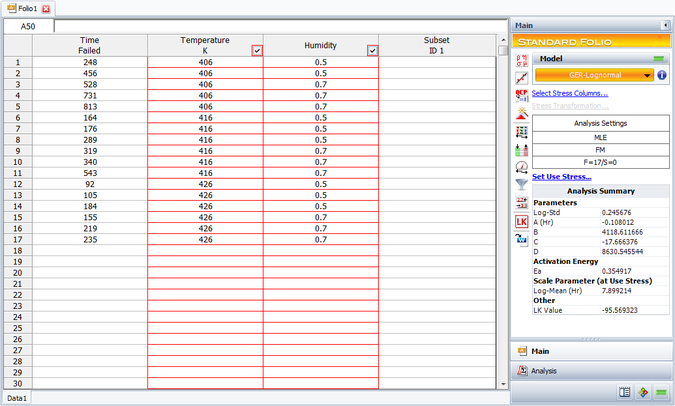
The following data set represents failure times (in hours) obtained from an electronics epoxy packaging accelerated life test performed to understand the synergy between temperature and humidity and estimate the <math>B10</math> life at the use conditions of <math>T=350K</math> and <math>H=0.3</math> . The data set is modeled using the lognormal distribution and the generalized Eyring model. | The following data set represents failure times (in hours) obtained from an electronics epoxy packaging accelerated life test performed to understand the synergy between temperature and humidity and estimate the <math>B10</math> life at the use conditions of <math>T=350K</math> and <math>H=0.3</math> . The data set is modeled using the lognormal distribution and the generalized Eyring model. | ||
[[Image:406-1-2.png|center|675px|]] | |||
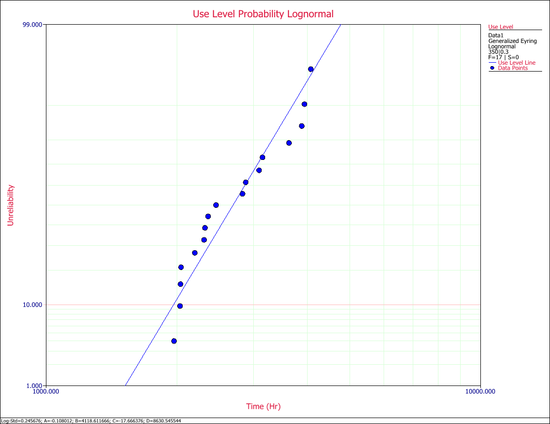
The probability plot at the use conditions is shown next. | |||
[[Image:plotfolio426.png|center|550px|]] | |||
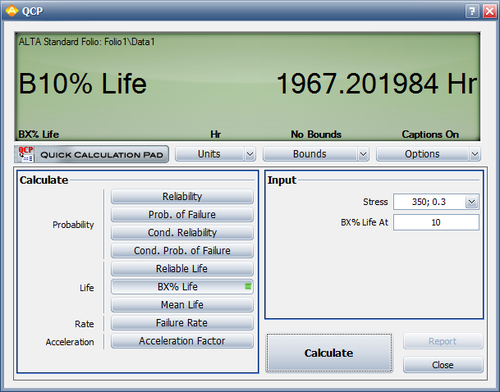
The <math>B10</math> information is estimated to be 1967.2 hours, as shown next. | The <math>B10</math> information is estimated to be 1967.2 hours, as shown next. | ||
[[Image:tempBX.png|center|500px|]] | |||
Revision as of 01:39, 9 August 2012
Generalized Eyring Example
The following data set represents failure times (in hours) obtained from an electronics epoxy packaging accelerated life test performed to understand the synergy between temperature and humidity and estimate the [math]\displaystyle{ B10 }[/math] life at the use conditions of [math]\displaystyle{ T=350K }[/math] and [math]\displaystyle{ H=0.3 }[/math] . The data set is modeled using the lognormal distribution and the generalized Eyring model.

The probability plot at the use conditions is shown next.

The [math]\displaystyle{ B10 }[/math] information is estimated to be 1967.2 hours, as shown next.
