Template:Example:TNT: Difference between revisions
Jump to navigation
Jump to search
Chuck Smith (talk | contribs) |
|||
| Line 5: | Line 5: | ||
<br> | <br> | ||
[[Image:ALTA10t1.png|center| | [[Image:ALTA10t1.png|center|175px|]] | ||
<br> | <br> | ||
| Line 22: | Line 22: | ||
A probability plot with the 2-sided 90% confidence bounds for the use stress levels of 323K and 2V is shown next. | A probability plot with the 2-sided 90% confidence bounds for the use stress levels of 323K and 2V is shown next. | ||
<br> | <br> | ||
[[Image:T-NT_Ex1.gif|thumb|center| | [[Image:T-NT_Ex1.gif|thumb|center|200px|Probability plot for the use stress levels of 323K and 2V]] | ||
<br> | <br> | ||
An acceleration factor plot, in which one of the stresses must be kept constant, can also be obtained. For example, in the following plot, the acceleration factor is plotted versus temperature given a constant voltage of 2V, as shown next. | An acceleration factor plot, in which one of the stresses must be kept constant, can also be obtained. For example, in the following plot, the acceleration factor is plotted versus temperature given a constant voltage of 2V, as shown next. | ||
<br> | <br> | ||
[[Image:T-NT_Ex2.gif|thumb|center| | [[Image:T-NT_Ex2.gif|thumb|center|200px|Acceleration facton versus temperature given a constant voltage of 2V]] | ||
<br> | <br> | ||
Revision as of 15:45, 26 April 2012
TNT Example
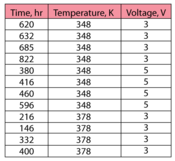
Twelve electronic devices were put into a continuous accelerated test and the following data were collected.

Using ALTA and the T-NT lognormal model, the following parameters were obtained:
- [math]\displaystyle{ \begin{align} \widehat{Std}=\ & 0.182558 \\ \widehat{B}=\ & 3729.650303 \\ \widehat{C}=\ & 0.035292 \\ \widehat{n}=\ & 0.776797 \end{align} }[/math]
A probability plot with the 2-sided 90% confidence bounds for the use stress levels of 323K and 2V is shown next.

An acceleration factor plot, in which one of the stresses must be kept constant, can also be obtained. For example, in the following plot, the acceleration factor is plotted versus temperature given a constant voltage of 2V, as shown next.
