Template:Example: Lognormal Distribution Bayesian Bound (Parameters): Difference between revisions
No edit summary |
No edit summary |
||
| Line 25: | Line 25: | ||
<math></math> | <math></math> | ||
[[Image:Lognormal Distribution Example 8 QCP.png|thumb|center| | [[Image:Lognormal Distribution Example 8 QCP.png|thumb|center|300px| ]] | ||
[[Image:Lognormal Distribution Example 8 Parameter Bounds.png|thumb|center| | [[Image:Lognormal Distribution Example 8 Parameter Bounds.png|thumb|center|300px| ]] | ||
Revision as of 21:22, 25 April 2012
Lognormal Distribution Bayesian Bound Example (Parameters)
Determine the two-sided 90% Bayesian confidence bounds on the lognormal parameter estimates for the data given next:
Solution
The data is entered into a Times-to-failure data sheet. The lognormal distribution is selected under Distributions. The Bayesian confidence bounds method only applies for the MLE analysis method, therefore, Maximum Likelihood (MLE) is selected under Analysis Method and Use Bayesian is selected under the Confidence Bounds Method in the Analysis tab.
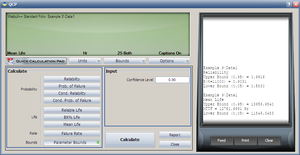
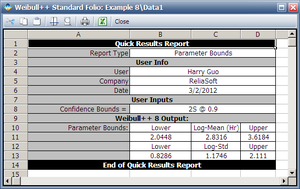
The two-sided 90% Bayesian confidence bounds on the lognormal parameter are obtained using the QCP and clicking on the Calculate Bounds button in the Parameter Bounds tab as follows:
[math]\displaystyle{ }[/math]

