Template:Example: Lognormal Distribution Likelihood Ratio Bound (Time)

From ReliaWiki
Revision as of 18:51, 13 February 2012 by Harry Guo (talk | contribs) (Created page with ''''Lognormal Distribution Likelihood Ratio Bound Example (Time)''' For the data given in Example 5, determine the two-sided 75% confidence bounds on the time estimate for a reli…')
(diff) ← Older revision | Latest revision (diff) | Newer revision → (diff)
Jump to navigation Jump to search

Lognormal Distribution Likelihood Ratio Bound Example (Time)

For the data given in Example 5, determine the two-sided 75% confidence bounds on the time estimate for a reliability of 80%. The ML estimate for the time at [math]\displaystyle{ R(t)=80% }[/math] is 55.718.

Solution

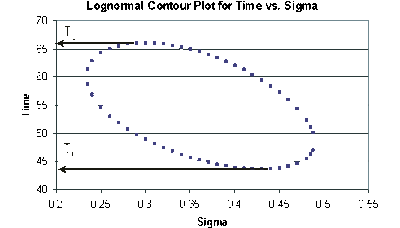
In this example, we are trying to determine the two-sided 75% confidence bounds on the time estimate of 55.718. This is accomplished by substituting [math]\displaystyle{ R=0.80 }[/math] and [math]\displaystyle{ \alpha =0.75 }[/math] into Eqn. (lognormliketr), and varying [math]\displaystyle{ {{\sigma }_{{{T}'}}} }[/math] until the maximum and minimum values of [math]\displaystyle{ t }[/math] are found. The following table gives the values of [math]\displaystyle{ t }[/math] based on given values of [math]\displaystyle{ {{\sigma }_{{{T}'}}} }[/math] .


[math]\displaystyle{ \begin{matrix} {{\sigma }_{{{T}'}}} & {{t}_{1}} & {{t}_{2}} & {{\sigma }_{{{T}'}}} & {{t}_{1}} & {{t}_{2}} \\ 0.24 & 56.832 & 62.879 & 0.37 & 44.841 & 64.031 \\ 0.25 & 54.660 & 64.287 & 0.38 & 44.494 & 63.454 \\ 0.26 & 53.093 & 65.079 & 0.39 & 44.200 & 62.809 \\ 0.27 & 51.811 & 65.576 & 0.40 & 43.963 & 62.093 \\ 0.28 & 50.711 & 65.881 & 0.41 & 43.786 & 61.304 \\ 0.29 & 49.743 & 66.041 & 0.42 & 43.674 & 60.436 \\ 0.30 & 48.881 & 66.085 & 0.43 & 43.634 & 59.481 \\ 0.31 & 48.106 & 66.028 & 0.44 & 43.681 & 58.426 \\ 0.32 & 47.408 & 65.883 & 0.45 & 43.832 & 57.252 \\ 0.33 & 46.777 & 65.657 & 0.46 & 44.124 & 55.924 \\ 0.34 & 46.208 & 65.355 & 0.47 & 44.625 & 54.373 \\ 0.35 & 45.697 & 64.983 & 0.48 & 45.517 & 52.418 \\ 0.36 & 45.242 & 64.541 & {} & {} & {} \\ \end{matrix} }[/math]


This data set is represented graphically in the following contour plot:

Ldachp9ex6.gif

As can be determined from the table, the lowest calculated value for [math]\displaystyle{ t }[/math] is 43.634, while the highest is 66.085. These represent the two-sided 75% confidence limits on the time at which reliability is equal to 80%.