Template:Example: Non-parametric LDA Confidence Bounds Example: Difference between revisions
Jump to navigation
Jump to search
Kate Racaza (talk | contribs) No edit summary |
No edit summary |
||
| Line 11: | Line 11: | ||
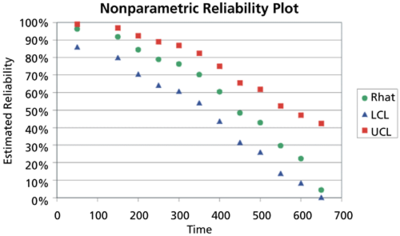
The following plot illustrates these results graphically: | The following plot illustrates these results graphically: | ||
[[Image: | [[Image:WB.17 nonparametric reliability plot.png|center|400px]] <br> | ||
Revision as of 16:33, 15 March 2012
Non-Parametric LDA Confidence Bounds Example
Determine the 1-sided confidence bounds for the reliability estimates in the Actuarial-Simple Example, with a 95% confidence level.
Solution
Once again, this type of problem is most readily solved by constructing a table similar to the following:

The following plot illustrates these results graphically:
