Template:Example: Recurrent Events Data Non-parameteric MCF Bound Example: Difference between revisions
Jump to navigation
Jump to search
[math]\displaystyle{ \begin{matrix}
ID & Months & State & MC{{F}_{i}} & Va{{r}_{i}} & MC{{F}_{{{L}_{i}}}} & MC{{F}_{{{U}_{i}}}} \\
\text{1} & \text{5} & \text{F} & \text{0}\text{.20} & \text{0}\text{.032} & 0.0459 & 0.8709 \\
\text{2} & \text{6} & \text{F} & \text{0}\text{.40} & \text{0}\text{.064} & 0.1413 & 1.1320 \\
\text{1} & \text{10} & \text{F} & \text{0}\text{.60} & \text{0}\text{.096} & 0.2566 & 1.4029 \\
\text{3} & \text{12} & \text{F} & \text{0}\text{.80} & \text{0}\text{.128} & 0.3834 & 1.6694 \\
\text{2} & \text{13} & \text{F} & \text{1}\text{.00} & \text{0}\text{.160} & 0.5179 & 1.9308 \\
\text{4} & \text{13} & \text{F} & \text{1}\text{.20} & \text{0}\text{.192} & 0.6582 & 2.1879 \\
\text{1} & \text{15} & \text{F} & \text{1}\text{.40} & \text{0}\text{.224} & 0.8028 & 2.4413 \\
\text{4} & \text{15} & \text{F} & \text{1}\text{.60} & \text{0}\text{.256} & 0.9511 & 2.6916 \\
\text{5} & \text{16} & \text{F} & \text{1}\text{.80} & \text{0}\text{.288} & 1.1023 & 2.9393 \\
\text{2} & \text{17} & \text{F} & \text{2}\text{.0} & \text{0}\text{.320} & 1.2560 & 3.1848 \\
\text{1} & \text{17} & \text{S} & {} & {} & {} & {} \\
\text{2} & \text{19} & \text{S} & {} & {} & {} & {} \\
\text{3} & \text{20} & \text{F} & \text{2}\text{.33} & \text{0}\text{.394} & 1.4990 & 3.6321 \\
\text{5} & \text{22} & \text{F} & \text{2}\text{.66} & \text{0}\text{.468} & 1.7486 & 4.0668 \\
\text{4} & \text{24} & \text{S} & {} & {} & {} & {} \\
\text{3} & \text{25} & \text{F} & \text{3}\text{.16} & \text{0}\text{.593} & 2.1226 & 4.7243 \\
\text{5} & \text{25} & \text{F} & \text{3}\text{.66} & \text{0}\text{.718} & 2.5071 & 5.3626 \\
\text{3} & \text{26} & \text{S} & {} & {} & {} & {} \\
\text{5} & \text{28} & \text{S} & {} & {} & {} & {} \\
\end{matrix} }[/math]
No edit summary |
Kate Racaza (talk | contribs) No edit summary |
||
| Line 1: | Line 1: | ||
'''Recurrent Events Data Non-parameteric MCF Bound Example''' | '''Recurrent Events Data Non-parameteric MCF Bound Example''' | ||
Using the data in [[Recurrent Events Data Non-parameteric MCF Example|Example 1]], estimate the 95% confidence bounds. | Using the data in [[Recurrent Events Data Non-parameteric MCF Example|Example 1]], estimate the 95% confidence bounds. | ||
<br>'''Solution''' | |||
Using the MCF variance equation, the following table of variance values can be obtained: | |||
{| border="1" align="center" | |||
{| | |||
|- | |- | ||
!ID | ! ID | ||
!Months | ! Months | ||
!State | ! State | ||
!< | ! <span class="texhtml">''r''<sub>''i''</sub></span> | ||
!< | ! <span class="texhtml">''V''''a''''r''<sub>''i''</sub></span> | ||
|- | |- | ||
|1 | | 1 | ||
| 5 | |||
| F | |||
| 5 | |||
| <math>(\tfrac{1}{5})^2[(1-\tfrac{1}{5})^2+4(0-\tfrac{1}{5})^2]=0.032</math> | |||
|- | |- | ||
|2 | | 2 | ||
| 6 | |||
| F | |||
| 5 | |||
| <math>0.032+(\tfrac{1}{5})^2[(1-\tfrac{1}{5})^2+4(0-\tfrac{1}{5})^2]=0.064</math> | |||
|- | |- | ||
| 1 | | 1 | ||
| 10 | |||
| F | |||
| 5 | |||
| <math>0.064+(\tfrac{1}{5})^2[(1-\tfrac{1}{5})^2+4(0-\tfrac{1}{5})^2]=0.096</math> | |||
|- | |- | ||
|3 | | 3 | ||
| 12 | |||
| F | |||
| 5 | |||
| <math>0.096+(\tfrac{1}{5})^2[(1-\tfrac{1}{5})^2+4(0-\tfrac{1}{5})^2]=0.128</math> | |||
|- | |- | ||
| 2 | | 2 | ||
| 13 | |||
| F | |||
| 5 | |||
| <math>0.128+(\tfrac{1}{5})^2[(1-\tfrac{1}{5})^2+4(0-\tfrac{1}{5})^2]=0.160</math> | |||
|- | |- | ||
| 4 | | 4 | ||
| 13 | |||
| F | |||
| 5 | |||
| <math>0.160+(\tfrac{1}{5})^2[(1-\tfrac{1}{5})^2+4(0-\tfrac{1}{5})^2]=0.192</math> | |||
|- | |- | ||
| 1 | | 1 | ||
| 15 | |||
| F | |||
| 5 | |||
| <math>0.192+(\tfrac{1}{5})^2[(1-\tfrac{1}{5})^2+4(0-\tfrac{1}{5})^2]=0.224</math> | |||
|- | |- | ||
| 4 | | 4 | ||
| 15 | |||
| F | |||
| 5 | |||
| <math>0.224+(\tfrac{1}{5})^2[(1-\tfrac{1}{5})^2+4(0-\tfrac{1}{5})^2]=0.256</math> | |||
|- | |- | ||
| 5 | | 5 | ||
| 16 | |||
| F | |||
| 5 | |||
| <math>0.256+(\tfrac{1}{5})^2[3(0-\tfrac{1}{5})^2+2(1-\tfrac{1}{5})^2]=0.288</math> | |||
|- | |- | ||
| 2 | | 2 | ||
| 17 | |||
| F | |||
| 5 | |||
| <math>0.288+(\tfrac{1}{5})^2[(1-\tfrac{1}{5})^2+4(0-\tfrac{1}{5})^2]=0.320</math> | |||
|- | |- | ||
| 1 | | 1 | ||
| 17 | |||
| S | |||
| 4 | |||
| | |||
|- | |- | ||
| 2 | | 2 | ||
| 19 | |||
| S | |||
| 3 | |||
| | |||
|- | |- | ||
| 3 | | 3 | ||
| 20 | |||
| F | |||
| 3 | |||
| <math>0.320+(\tfrac{1}{5})^2[(1-\tfrac{1}{5})^2+2(0-\tfrac{1}{5})^2]=0.394</math> | |||
|- | |- | ||
| 5 | | 5 | ||
| 22 | |||
| F | |||
| 3 | |||
| <math>0.394+(\tfrac{1}{5})^2[2(0-\tfrac{1}{5})^2+4(1-\tfrac{1}{5})^2]=0.468</math> | |||
|- | |- | ||
| 4 | | 4 | ||
| 24 | |||
| S | |||
| 2 | |||
| | |||
|- | |- | ||
| 3 | | 3 | ||
| 25 | |||
| F | |||
| 2 | |||
| <math>0.468+(\tfrac{1}{5})^2[(1-\tfrac{1}{5})^2+4(0-\tfrac{1}{5})^2]=0.593</math> | |||
|- | |- | ||
| 5 | | 5 | ||
| 25 | |||
| F | |||
| 2 | |||
| <math>0.580+(\tfrac{1}{5})^2[(0-\tfrac{1}{5})^2+4(1-\tfrac{1}{5})^2]=0.718</math> | |||
|- | |- | ||
| 3 | | 3 | ||
| 26 | |||
| S | |||
| 1 | |||
| | |||
|- | |- | ||
| 5 | | 5 | ||
|} | | 28 | ||
| S | |||
| 0 | |||
| | |||
|} | |||
Using the equation for the MCF bounds and <span class="texhtml">''K''<sub>5</sub> = 1.644</span> for a 95% confidence level, the confidence bounds can be obtained as follows: | |||
<center><math>\begin{matrix} | <center><math>\begin{matrix} | ||
ID & Months & State & MC{{F}_{i}} & Va{{r}_{i}} & MC{{F}_{{{L}_{i}}}} & MC{{F}_{{{U}_{i}}}} \\ | ID & Months & State & MC{{F}_{i}} & Va{{r}_{i}} & MC{{F}_{{{L}_{i}}}} & MC{{F}_{{{U}_{i}}}} \\ | ||
| Line 80: | Line 153: | ||
\text{5} & \text{28} & \text{S} & {} & {} & {} & {} \\ | \text{5} & \text{28} & \text{S} & {} & {} & {} & {} \\ | ||
\end{matrix}</math></center> | \end{matrix}</math></center> | ||
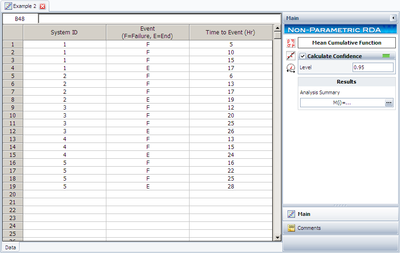
The analysis presented in this example can be obtained automatically in Weibull ++ using the non-parametric RDA folio, as shown next. | |||
[[Image:Recurrent Data Example 2 Data.png|thumb|center|400px]] | |||
[[Image:Recurrent Data Example 2 Data.png|thumb|center|400px | |||
Note: In the above | Note: In the folio above, the <span class="texhtml">''F''</span> refers to failures and <span class="texhtml">''E''</span> refers to suspensions (or censoring ages). | ||
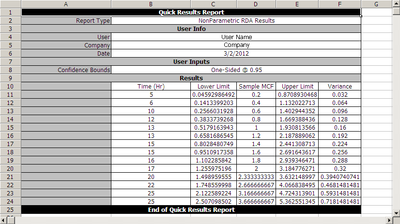
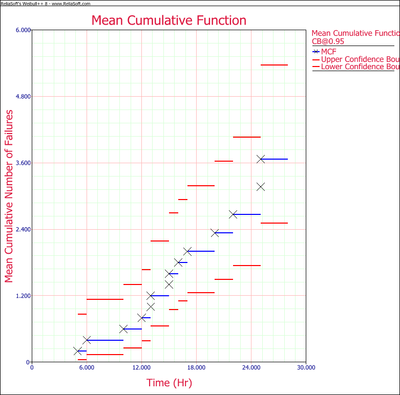
The results with calculated MCF values and upper and lower 95% confidence limits are shown next along with the graphical plot. | The results, with calculated MCF values and upper and lower 95% confidence limits, are shown next along with the graphical plot. | ||
[[Image:Recurrent Data Example 2 Result.png|thumb|center|400px | [[Image:Recurrent Data Example 2 Result.png|thumb|center|400px]] | ||
[[Image:Recurrent Data Example 2 Plot.png|thumb|center|400px | [[Image:Recurrent Data Example 2 Plot.png|thumb|center|400px]] | ||
Revision as of 16:53, 8 March 2012
Recurrent Events Data Non-parameteric MCF Bound Example
Using the data in Example 1, estimate the 95% confidence bounds.
Solution
Using the MCF variance equation, the following table of variance values can be obtained:
| ID | Months | State | ri | V'a'ri |
|---|---|---|---|---|
| 1 | 5 | F | 5 | [math]\displaystyle{ (\tfrac{1}{5})^2[(1-\tfrac{1}{5})^2+4(0-\tfrac{1}{5})^2]=0.032 }[/math] |
| 2 | 6 | F | 5 | [math]\displaystyle{ 0.032+(\tfrac{1}{5})^2[(1-\tfrac{1}{5})^2+4(0-\tfrac{1}{5})^2]=0.064 }[/math] |
| 1 | 10 | F | 5 | [math]\displaystyle{ 0.064+(\tfrac{1}{5})^2[(1-\tfrac{1}{5})^2+4(0-\tfrac{1}{5})^2]=0.096 }[/math] |
| 3 | 12 | F | 5 | [math]\displaystyle{ 0.096+(\tfrac{1}{5})^2[(1-\tfrac{1}{5})^2+4(0-\tfrac{1}{5})^2]=0.128 }[/math] |
| 2 | 13 | F | 5 | [math]\displaystyle{ 0.128+(\tfrac{1}{5})^2[(1-\tfrac{1}{5})^2+4(0-\tfrac{1}{5})^2]=0.160 }[/math] |
| 4 | 13 | F | 5 | [math]\displaystyle{ 0.160+(\tfrac{1}{5})^2[(1-\tfrac{1}{5})^2+4(0-\tfrac{1}{5})^2]=0.192 }[/math] |
| 1 | 15 | F | 5 | [math]\displaystyle{ 0.192+(\tfrac{1}{5})^2[(1-\tfrac{1}{5})^2+4(0-\tfrac{1}{5})^2]=0.224 }[/math] |
| 4 | 15 | F | 5 | [math]\displaystyle{ 0.224+(\tfrac{1}{5})^2[(1-\tfrac{1}{5})^2+4(0-\tfrac{1}{5})^2]=0.256 }[/math] |
| 5 | 16 | F | 5 | [math]\displaystyle{ 0.256+(\tfrac{1}{5})^2[3(0-\tfrac{1}{5})^2+2(1-\tfrac{1}{5})^2]=0.288 }[/math] |
| 2 | 17 | F | 5 | [math]\displaystyle{ 0.288+(\tfrac{1}{5})^2[(1-\tfrac{1}{5})^2+4(0-\tfrac{1}{5})^2]=0.320 }[/math] |
| 1 | 17 | S | 4 | |
| 2 | 19 | S | 3 | |
| 3 | 20 | F | 3 | [math]\displaystyle{ 0.320+(\tfrac{1}{5})^2[(1-\tfrac{1}{5})^2+2(0-\tfrac{1}{5})^2]=0.394 }[/math] |
| 5 | 22 | F | 3 | [math]\displaystyle{ 0.394+(\tfrac{1}{5})^2[2(0-\tfrac{1}{5})^2+4(1-\tfrac{1}{5})^2]=0.468 }[/math] |
| 4 | 24 | S | 2 | |
| 3 | 25 | F | 2 | [math]\displaystyle{ 0.468+(\tfrac{1}{5})^2[(1-\tfrac{1}{5})^2+4(0-\tfrac{1}{5})^2]=0.593 }[/math] |
| 5 | 25 | F | 2 | [math]\displaystyle{ 0.580+(\tfrac{1}{5})^2[(0-\tfrac{1}{5})^2+4(1-\tfrac{1}{5})^2]=0.718 }[/math] |
| 3 | 26 | S | 1 | |
| 5 | 28 | S | 0 |
Using the equation for the MCF bounds and K5 = 1.644 for a 95% confidence level, the confidence bounds can be obtained as follows:
The analysis presented in this example can be obtained automatically in Weibull ++ using the non-parametric RDA folio, as shown next.
Note: In the folio above, the F refers to failures and E refers to suspensions (or censoring ages).
The results, with calculated MCF values and upper and lower 95% confidence limits, are shown next along with the graphical plot.


