Template:Example: Recurrent Events Data Parameteric Air-Condition Example: Difference between revisions
Jump to navigation
Jump to search
[math]\displaystyle{ \begin{matrix}
\text{50} & \text{329} & \text{811} & \text{991} & \text{1489} \\
\text{94} & \text{332} & \text{899} & \text{1013} & \text{1512} \\
\text{196} & \text{347} & \text{945} & \text{1152} & \text{1525} \\
\text{268} & \text{544} & \text{950} & \text{1362} & \text{1539} \\
\text{290} & \text{732} & \text{955} & \text{1459} & {} \\
\end{matrix} }[/math]
No edit summary |
Kate Racaza (talk | contribs) No edit summary |
||
| Line 1: | Line 1: | ||
''' Recurrent Events Data | '''Recurrent Events Data Parametric Air-Condition Example''' | ||
The following table gives the failure times of the air-condition unit of an aircraft. The observation ended by the time of the failure occurred. [[Appendix: Weibull References|[3]]] | |||
<center><math>\begin{matrix} | <center><math>\begin{matrix} | ||
\text{50} & \text{329} & \text{811} & \text{991} & \text{1489} \\ | \text{50} & \text{329} & \text{811} & \text{991} & \text{1489} \\ | ||
| Line 10: | Line 9: | ||
\text{290} & \text{732} & \text{955} & \text{1459} & {} \\ | \text{290} & \text{732} & \text{955} & \text{1459} & {} \\ | ||
\end{matrix}</math></center> | \end{matrix}</math></center> | ||
:1. Estimate the GRP model parameters using the Type I virtual age option. | :1. Estimate the GRP model parameters using the Type I virtual age option. | ||
| Line 19: | Line 17: | ||
:4. Using the QCP, calculate the expected failure number and expected instantaneous failure intensity by time 1800. | :4. Using the QCP, calculate the expected failure number and expected instantaneous failure intensity by time 1800. | ||
<br>'''Solution''' | |||
Enter the data into a parametric RDA folio in Weibull++. Choose '''3''' under Parameters and '''Type I''' under Settings. Keep the default simulation settings. | |||
Enter the data into a | |||
:1. The estimated parameters are | :1. The estimated parameters are <math>\hat{\beta }=1.1976,</math> <math>\hat{\lambda }=4.94E-03,</math> <math>\hat{q}=0.1344</math> . | ||
:2. The failure number and instantaneous failure intensity are given in the following plots. | :2. The failure number and instantaneous failure intensity are given in the following plots. | ||
[[Image:Parametric RDA N(T) plot.png|thumb|center|400px | [[Image:Parametric RDA N(T) plot.png|thumb|center|400px]] | ||
[[Image:Parametric RDA Lambda(T) plot.png|thumb|center|400px | [[Image:Parametric RDA Lambda(T) plot.png|thumb|center|400px]] | ||
:3. The conditional reliability is plotted below. | :3. The conditional reliability is plotted below. | ||
[[Image:Parametric RDA Cond R(T) plot.png|thumb|center|400px | [[Image:Parametric RDA Cond R(T) plot.png|thumb|center|400px]] | ||
:4. Using QCP, the failure number and instantaneous failure intensity are: | :4. Using QCP, the failure number and instantaneous failure intensity are: | ||
[[Image:QCP N(T).png|thumb|center|400px | [[Image:QCP N(T).png|thumb|center|400px]] | ||
[[Image:QCP Lambda(T).png|thumb|center|400px | [[Image:QCP Lambda(T).png|thumb|center|400px]] | ||
Revision as of 16:17, 8 March 2012
Recurrent Events Data Parametric Air-Condition Example
The following table gives the failure times of the air-condition unit of an aircraft. The observation ended by the time of the failure occurred. [3]
- 1. Estimate the GRP model parameters using the Type I virtual age option.
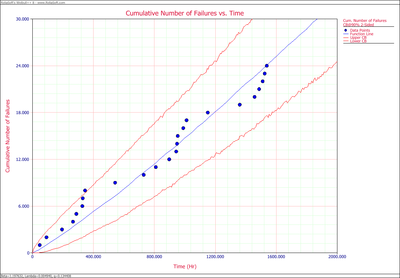
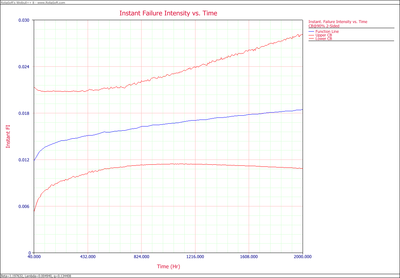
- 2. Plot the failure number and instantaneous failure intensity vs. time with 90% two-sided confidence bounds.
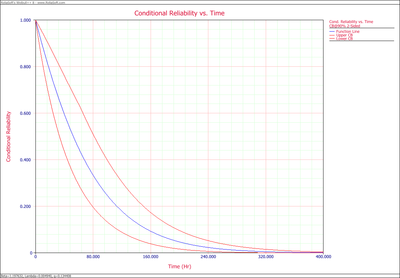
- 3. Plot the conditional reliability vs. time with 90% two-sided confidence bounds. The mission start time is 40 and mission time is varying.
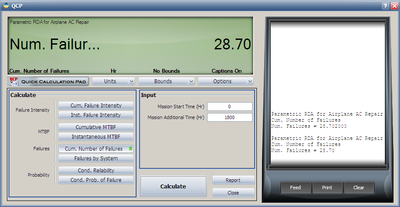
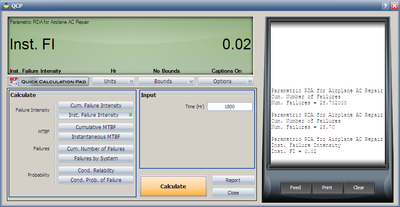
- 4. Using the QCP, calculate the expected failure number and expected instantaneous failure intensity by time 1800.
Solution
Enter the data into a parametric RDA folio in Weibull++. Choose 3 under Parameters and Type I under Settings. Keep the default simulation settings.
- 1. The estimated parameters are [math]\displaystyle{ \hat{\beta }=1.1976, }[/math] [math]\displaystyle{ \hat{\lambda }=4.94E-03, }[/math] [math]\displaystyle{ \hat{q}=0.1344 }[/math] .
- 2. The failure number and instantaneous failure intensity are given in the following plots.
- 3. The conditional reliability is plotted below.
- 4. Using QCP, the failure number and instantaneous failure intensity are:
