Template:Example: Warranty Analysis Nevada Format Example
Warranty Analysis Nevada Format Example
A company keeps track of its shipments and warranty returns on a month-by-month basis. The data format that the company uses is the Nevada format. Following is a table for shipments in June, July, and August, and the warranty returns through September:
| RETURNS | ||||
| SHIP | Jul. 2010 | Aug. 2010 | Sep. 2010 | |
| Jun. 2010 | 100 | 3 | 3 | 5 |
| Jul. 2010 | 140 | - | 2 | 4 |
| Aug. 2010 | 150 | - | - | 4 |
Convert this information to life data, and determine the parameters for a two-parameter Weibull distribution.
Solution
We will examine the data month by month. In June 100 units were sold, and in July 3 of these units were returned. This gives 3 failures at one month for the June shipment, which we will denote as [math]\displaystyle{ {{F}_{JUN,1}}=3 }[/math] . Likewise, 3 failures occurred in August and 5 occurred in September for this shipment, or [math]\displaystyle{ {{F}_{JUN,2}}=3 }[/math] and [math]\displaystyle{ {{F}_{JUN,3}}=5 }[/math]. Consequently, at the end of our three-month analysis period, there were a total of 11 failures for the 100 units shipped in June. This means that 89 units are presumably still operating, and can be considered suspensions at three months, or [math]\displaystyle{ {{S}_{JUN,3}}=89 }[/math]. For the shipment of 140 in July, 2 were returned the following month, or [math]\displaystyle{ {{F}_{JUL,1}}=2 }[/math] , and 4 more were returned the month after that, or [math]\displaystyle{ {{F}_{JUL,2}}=4 }[/math]. After two months, there are 134 ( [math]\displaystyle{ 140-2-4=134 }[/math] ) units from the July shipment still operating, or [math]\displaystyle{ {{S}_{JUL,2}}=134 }[/math]. For the final shipment of 150 in August, 4 fail in September, or [math]\displaystyle{ {{F}_{AUG,1}}=4 }[/math], with the remaining 146 units being suspensions at one month, or [math]\displaystyle{ {{S}_{AUG,1}}=146 }[/math].
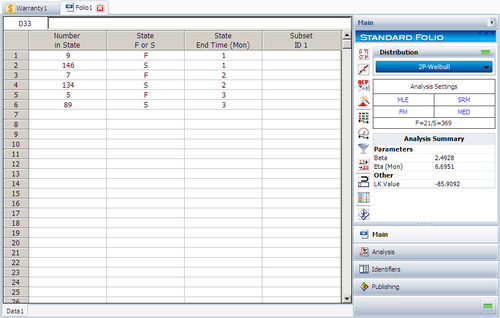
It is now a simple matter to add up the number of failures for 1, 2, and 3 months, then add the suspensions to get our reliability data set:
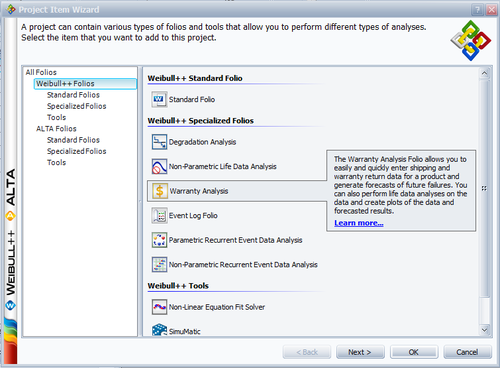
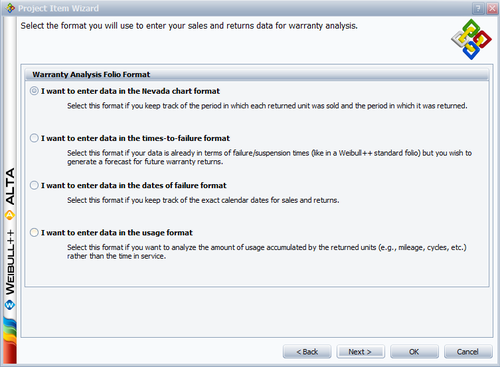
To perform this analysis in Weibull++, create a warranty analysis folio and choose I want to enter data in Nevada format in the Project Wizard.
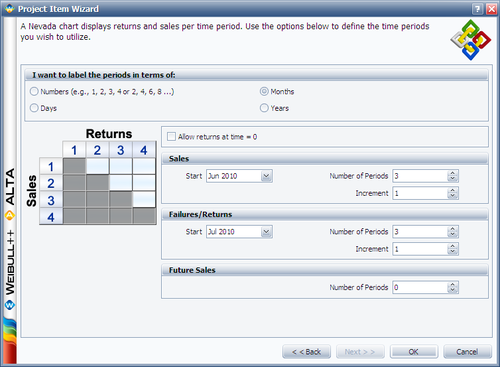
The next window allows you to specify the time units used. For this example select Months under I want to use the following unit type for each period and enter the Start month and Number of Periods and Increment number for the sales data and failure/return data as follows:
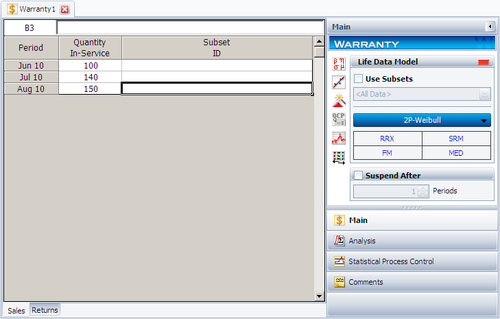
The sales data are entered as follows:
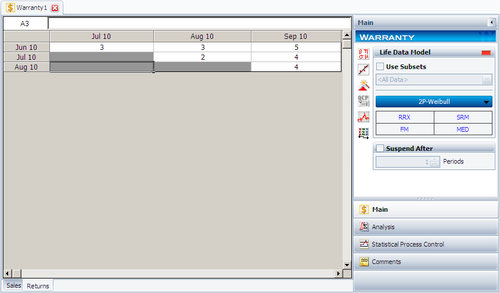
The return data are entered as follows:
The data can now be analyzed. Select 2-parameter Weibull as the distribution type and MLE as the analysis method and click the Calculate button. The estimated parameters are [math]\displaystyle{ \widehat{\beta }=2.49 }[/math] and [math]\displaystyle{ \widehat{\eta }=6.70. }[/math]
Even though this step is not required for the analysis, the data can also be transferred to a Weibull++ data sheet for illustrative purposes or for ancillary analysis. This can be done by clicking the Transfer Life Data to New Folio button:
[math]\displaystyle{ }[/math]
or choosing this option under the Data menu.
The equivalent Times-to-failure folio is as follows:
