Template:Gumbel probability paper: Difference between revisions
| Line 32: | Line 32: | ||
The Gumbel probability paper resulting from this linearized <math>cdf</math> function is shown next. | The Gumbel probability paper resulting from this linearized <math>cdf</math> function is shown next. | ||
[[Image:WB.16 probability gumbel.png|center| | [[Image:WB.16 probability gumbel.png|center|250px| ]] | ||
For <math>z=0</math> , <math>t=\mu </math> and <math>R(t)={{e}^{-{{e}^{0}}}}\approx 0.3678</math> (63.21% unreliability). For <math>z=1</math> , <math>\sigma =T-\mu </math> and <math>R(t)={{e}^{-{{e}^{1}}}}\approx 0.0659.</math> To read <math>\mu </math> from the plot, find the time value that corresponds to the intersection of the probability plot with the 63.21% unreliability line. To read <math>\sigma </math> from the plot, find the time value that corresponds to the intersection of the probability plot with the 93.40% unreliability line, then take the difference between this time value and the <math>\mu </math> value. | For <math>z=0</math> , <math>t=\mu </math> and <math>R(t)={{e}^{-{{e}^{0}}}}\approx 0.3678</math> (63.21% unreliability). For <math>z=1</math> , <math>\sigma =T-\mu </math> and <math>R(t)={{e}^{-{{e}^{1}}}}\approx 0.0659.</math> To read <math>\mu </math> from the plot, find the time value that corresponds to the intersection of the probability plot with the 63.21% unreliability line. To read <math>\sigma </math> from the plot, find the time value that corresponds to the intersection of the probability plot with the 93.40% unreliability line, then take the difference between this time value and the <math>\mu </math> value. | ||
Revision as of 21:59, 25 April 2012
Probability Paper
The form of the Gumbel probability paper is based on a linearization of the [math]\displaystyle{ cdf }[/math] . From the unreliabililty equation, we know:
- [math]\displaystyle{ z=\ln (-\ln (1-F)) }[/math]
using the equation for z, we get:
- [math]\displaystyle{ \frac{t-\mu }{\sigma }=\ln (-\ln (1-F)) }[/math]
Then:
- [math]\displaystyle{ \ln (-\ln (1-F))=-\frac{\mu }{\sigma }+\frac{1}{\sigma }t }[/math]
Now let:
- [math]\displaystyle{ y=\ln (-\ln (1-F)) }[/math]
- [math]\displaystyle{ x=t }[/math]
and:
- [math]\displaystyle{ \begin{align} & a= & -\frac{\mu }{\sigma } \\ & b= & \frac{1}{\sigma } \end{align} }[/math]
which results in the linear equation of:
- [math]\displaystyle{ y=a+bx }[/math]
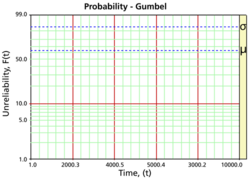
The Gumbel probability paper resulting from this linearized [math]\displaystyle{ cdf }[/math] function is shown next.
For [math]\displaystyle{ z=0 }[/math] , [math]\displaystyle{ t=\mu }[/math] and [math]\displaystyle{ R(t)={{e}^{-{{e}^{0}}}}\approx 0.3678 }[/math] (63.21% unreliability). For [math]\displaystyle{ z=1 }[/math] , [math]\displaystyle{ \sigma =T-\mu }[/math] and [math]\displaystyle{ R(t)={{e}^{-{{e}^{1}}}}\approx 0.0659. }[/math] To read [math]\displaystyle{ \mu }[/math] from the plot, find the time value that corresponds to the intersection of the probability plot with the 63.21% unreliability line. To read [math]\displaystyle{ \sigma }[/math] from the plot, find the time value that corresponds to the intersection of the probability plot with the 93.40% unreliability line, then take the difference between this time value and the [math]\displaystyle{ \mu }[/math] value.
