Template:Nevada chart format: Difference between revisions
Jump to navigation
Jump to search
No edit summary |
Chris Kahn (talk | contribs) No edit summary |
||
| Line 3: | Line 3: | ||
[[Image:Nevada-Chart-Illustration.png|center| | [[Image:Nevada-Chart-Illustration.png|center|500px| ]] | ||
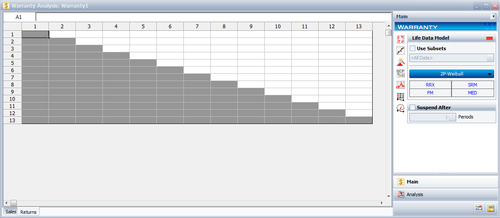
In Weibull++ this window is as shown next: | In Weibull++ this window is as shown next: | ||
[[Image:warrantyreturns.png|center| | [[Image:warrantyreturns.png|center|500px| ]] | ||
Revision as of 21:47, 2 May 2012
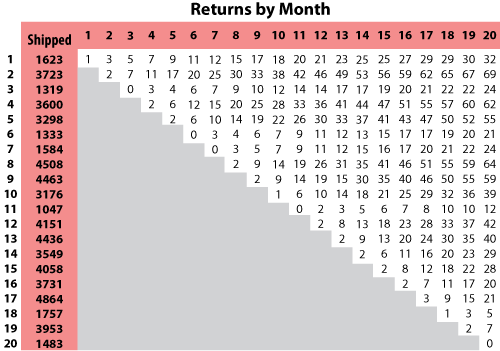
Nevada Chart Format
Field information frequently appears in terms of units produced and/or shipped in a certain time period, with the resulting returns for that production lot in the subsequent time periods. This information can be arranged in a diagonal chart, as displayed in the following figure.

In Weibull++ this window is as shown next:
