Template:Standard model overview gompz
Standard Model Overview
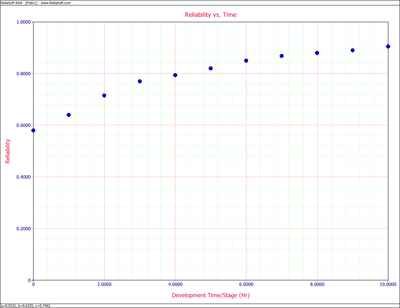
The Gompertz reliability growth model is often used when analyzing reliability data. It is most applicable when the data set follows a smooth curve, as shown in Figure oldfig31. The Gompertz model is mathematically given by [1]:
- [math]\displaystyle{ R=a{{b}^{{{c}^{T}}}} }[/math]
where:
• [math]\displaystyle{ 0\lt a\le 1 }[/math]
• [math]\displaystyle{ 0\lt b\lt 1 }[/math]
• [math]\displaystyle{ 0\lt c\lt 1 }[/math]
• [math]\displaystyle{ T\gt 0 }[/math]
• [math]\displaystyle{ R= }[/math] the system's reliability at development time, launch number or stage number, [math]\displaystyle{ T }[/math] .
• [math]\displaystyle{ a= }[/math] the upper limit that the reliability approaches asymptotically as [math]\displaystyle{ T\to \infty }[/math] , or the maximum reliability that can be attained.
• [math]\displaystyle{ ab= }[/math] initial reliability at [math]\displaystyle{ T=0. }[/math]
• [math]\displaystyle{ c= }[/math] the growth pattern indicator (small values of [math]\displaystyle{ c }[/math] indicate rapid early reliability growth and large values of [math]\displaystyle{ c }[/math] indicate slow reliability growth).
As it can be seen from the mathematical definition, the Gompertz model is a 3-parameter model with the parameters [math]\displaystyle{ a }[/math] , [math]\displaystyle{ b }[/math] and [math]\displaystyle{ c }[/math] . The solution for the parameters, given [math]\displaystyle{ {{T}_{i}} }[/math] and [math]\displaystyle{ {{R}_{i}} }[/math] , is accomplished by fitting the best possible line through the data points. Many methods are available; all of which tend to be numerically intensive. When analyzing reliability data in RGA, you have the option to enter the reliability values in percent or in decimal format. However, [math]\displaystyle{ a }[/math] will always be returned in decimal format and not in percent. The estimated parameters in RGA are unitless. The next section presents an overview and background on some of the most commonly used algorithms/methods for obtaining these parameters.
