Template:Voltage Step-Stress Example: Difference between revisions
Nikki Helms (talk | contribs) |
Chuck Smith (talk | contribs) |
||
| Line 5: | Line 5: | ||
<br> | <br> | ||
<br> | <br> | ||
[[Image:ALTA14.20.png|center| | [[Image:ALTA14.20.png|center|250px|]] | ||
<br> | <br> | ||
| Line 21: | Line 21: | ||
<br> | <br> | ||
<br> | <br> | ||
[[Image:chp14-65.gif|thumb|center| | [[Image:chp14-65.gif|thumb|center|200px|]] | ||
<br> | <br> | ||
[[Image:ALTA14.21.gif|thumb|center| | [[Image:ALTA14.21.gif|thumb|center|200px|The voltage test profile as in ALTA.]] | ||
<br> | <br> | ||
| Line 29: | Line 29: | ||
<br> | <br> | ||
[[Image:chp14-66.gif|thumb|center| | [[Image:chp14-66.gif|thumb|center|200px|]] | ||
| Line 35: | Line 35: | ||
[[Image:Ch12-Ex9-4.gif|thumb|center| | [[Image:Ch12-Ex9-4.gif|thumb|center|200px|]] | ||
<br> | <br> | ||
Revision as of 23:30, 25 April 2012
Voltage Step-Stress Example
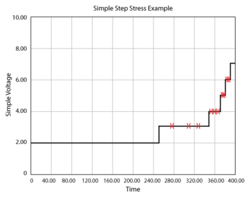
An electronic component was subjected to a voltage stress, starting at 2V (use stress level) and increased to 7V in stepwise increments. The following steps, in hours, were used to apply stress to the products under test: 0 to 250, 2V; 250 to 350, 3V; 350 to 370, 4V; 370 to 380, 5V; 380 to 390, 6V; and 390 to 400, 7V. This profile is represented graphically next.
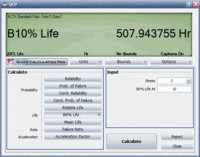
The objective of this test was to determine the [math]\displaystyle{ B10 }[/math] life of these components at the normal use stress level of 2V.
In this experiment, the overall test time was 385 hrs. If the test had been performed at use conditions, one would expect the test duration to be approximately 1700 hrs if the test were run until all units failed.
Eleven units were available for the test. All eleven units were tested using the same stress profile. Units that failed were removed from the test and their total time on test recorded. The following times-to-failure were observed in the test, in hours: 280, 310, 330, 352, 360, 366, 371, 374, 378, 381 and 385.
Solution
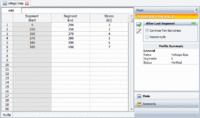
After creating a Standard Folio for a single stress (voltage), the analyst added a Stress Profile under Tools in the Project Manager to create the stress profile for this experiment. In ALTA's stress profile, you can define any stress profile in segments. The stress applied during these segments can be a constant value (as is the case in this step example) or defined as a function of a time variable (t). The stress profile for this analysis is displayed next.
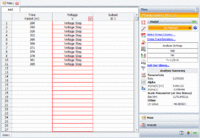
The times-to-failure data are entered in the ALTA Standard Folio with the following analysis options selected: cumulative damage power life-stress relationship and Weibull for the underlying life distribution. The ALTA Standard Folio with the data entered and the estimated parameters is shown next. Notice that the voltage step-stress profile has been assigned to each data point.
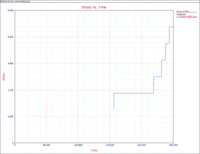
The [math]\displaystyle{ B10 }[/math] life at the 2V use stress level, can be calculated with ALTA's Quick Calculation Pad (QCP), as shown next.
