Template:Weibull degradation vs time plot: Difference between revisions
Jump to navigation
Jump to search
No edit summary |
Chris Kahn (talk | contribs) |
||
| Line 3: | Line 3: | ||
[[Image:degradationvstime.png|left|200px]] | [[Image:degradationvstime.png|left|200px]] | ||
<br> | |||
Revision as of 21:48, 25 April 2012
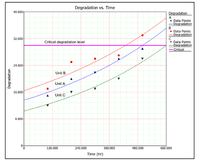
Degradation vs. Time
The Degradation vs. Time plot shows how the performance of each unit ID degrades over time. You can select to plot the data points on a linear scale or on a logarithmic scale. The following example shows the linear scale plot. As you can see, unit B is expected to reach the critical degradation level first, compared to the other units.
