Weibull++ Non-Parametric LDA Plot Example: Difference between revisions
(Created page with '{{Weibull++ Non-Parametric LDA Plot Example}}') |
Kate Racaza (talk | contribs) No edit summary |
||
| (One intermediate revision by the same user not shown) | |||
| Line 1: | Line 1: | ||
{{Weibull++ | <noinclude>{{Banner Weibull Examples}}</noinclude> | ||
This example demonstrates how to use the Weibull++ non-parametric life data analysis (LDA) folio. | |||
Assume we have the following data. | |||
{| border="1" align="center" style="border-collapse: collapse;" cellpadding="5" cellspacing="5" | |||
| align="center" style="background:#f0f0f0;"|'''Number in State''' | |||
| align="center" style="background:#f0f0f0;"|'''State F or S''' | |||
| align="center" style="background:#f0f0f0;"|'''State End Time''' | |||
|- | |||
| 3||F||9 | |||
|- | |||
| 1||S||9 | |||
|- | |||
| 1||F||11 | |||
|- | |||
| 1||S||12 | |||
|- | |||
| 1||F||13 | |||
|- | |||
| 1||S||13 | |||
|- | |||
| 1||S||15 | |||
|- | |||
| 1||F||17 | |||
|- | |||
| 1||F||21 | |||
|- | |||
| 1||S||22 | |||
|- | |||
| 1||S||24 | |||
|- | |||
| 1||S||26 | |||
|- | |||
| 1||F||28 | |||
|- | |||
| 1||F||30 | |||
|- | |||
| 1||S||32 | |||
|- | |||
| 2||S||35 | |||
|- | |||
| 1||S||39 | |||
|- | |||
| 1||S||41 | |||
|} | |||
Analyze the data set using the Kaplan-Meier method. | |||
'''Solution''' | |||
Enter the data in a non-parametric LDA folio. On the folio's control panel, enter a confidence level, as shown next. | |||
[[Image: Kaplan Meier Method Data.png|center|550px]] | |||
The following plot shows the results, where the reliability at each failure time is calculated and plotted, along with the confidence bounds. | |||
[[Image: Kaplan Meier Method Plot.png|center|550px]] | |||
Because the analysis uses a non-parametric method, only the reliability at the observed failure times can be calculated. Non-parametric methods cannot be used for extrapolation and interpolation. | |||
The following report shows the estimated reliability values and the associated confidence bounds. | |||
[[Image: Kaplan Meier Summary Results.png|center|550px]] | |||
Latest revision as of 06:18, 16 August 2012
New format available! This reference is now available in a new format that offers faster page load, improved display for calculations and images and more targeted search.
As of January 2024, this Reliawiki page will not continue to be updated. Please update all links and bookmarks to the latest references at Weibull examples and Weibull reference examples.
This example demonstrates how to use the Weibull++ non-parametric life data analysis (LDA) folio.
Assume we have the following data.
| Number in State | State F or S | State End Time |
| 3 | F | 9 |
| 1 | S | 9 |
| 1 | F | 11 |
| 1 | S | 12 |
| 1 | F | 13 |
| 1 | S | 13 |
| 1 | S | 15 |
| 1 | F | 17 |
| 1 | F | 21 |
| 1 | S | 22 |
| 1 | S | 24 |
| 1 | S | 26 |
| 1 | F | 28 |
| 1 | F | 30 |
| 1 | S | 32 |
| 2 | S | 35 |
| 1 | S | 39 |
| 1 | S | 41 |
Analyze the data set using the Kaplan-Meier method.
Solution
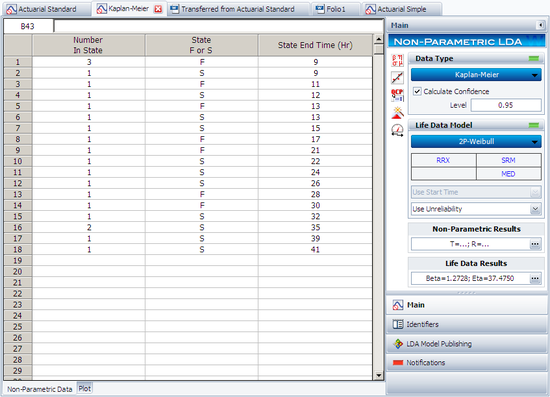
Enter the data in a non-parametric LDA folio. On the folio's control panel, enter a confidence level, as shown next.
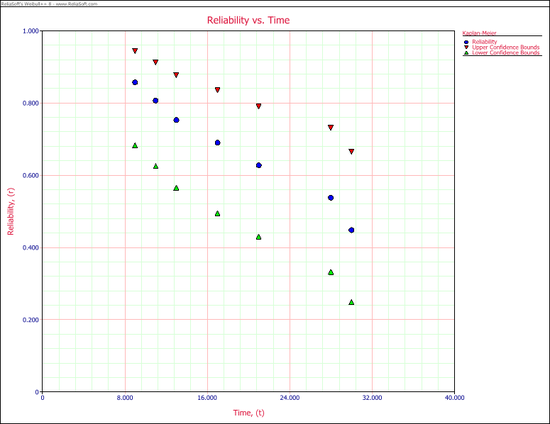
The following plot shows the results, where the reliability at each failure time is calculated and plotted, along with the confidence bounds.
Because the analysis uses a non-parametric method, only the reliability at the observed failure times can be calculated. Non-parametric methods cannot be used for extrapolation and interpolation.
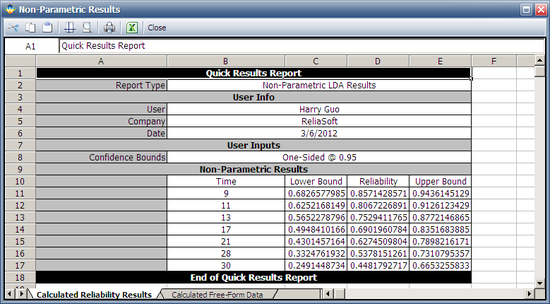
The following report shows the estimated reliability values and the associated confidence bounds.


