Grouped per Configuration - Lloyd-Lipow Model
Jump to navigation
Jump to search
 |
New format available! This reference is now available in a new format that offers faster page load, improved display for calculations and images and more targeted search.
As of January 2024, this Reliawiki page will not continue to be updated. Please update all links and bookmarks to the latest references at RGA examples and RGA reference examples.
This example appears in the Reliability growth reference.
A 15-stage reliability development test program was performed. The grouped per configuration data set is shown in the following table. Do the following:
- Fit the Lloyd-Lipow model to the data using MLE.
- What is the maximum reliability attained as the number of test stages approaches infinity?
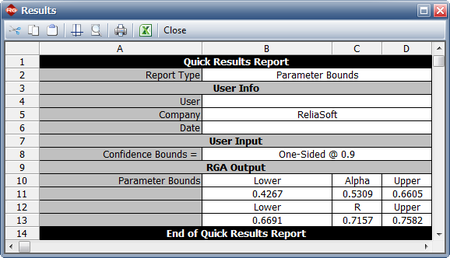
- What is the maximum achievable reliability with a 90% confidence level?
| Stage, [math]\displaystyle{ k\,\! }[/math] | Number of Tests ([math]\displaystyle{ n_k\,\! }[/math]) | Number of Successes ([math]\displaystyle{ S_k\,\! }[/math]) |
|---|---|---|
| 1 | 10 | 3 |
| 2 | 10 | 3 |
| 3 | 10 | 4 |
| 4 | 10 | 5 |
| 5 | 10 | 5 |
| 6 | 12 | 6 |
| 7 | 12 | 5 |
| 8 | 12 | 7 |
| 9 | 14 | 8 |
| 10 | 14 | 8 |
| 11 | 14 | 10 |
| 12 | 14 | 12 |
| 13 | 14 | 11 |
| 14 | 14 | 12 |
| 15 | 14 | 12 |
Solution
- The figure below displays the entered data and the estimated Lloyd-Lipow parameters.
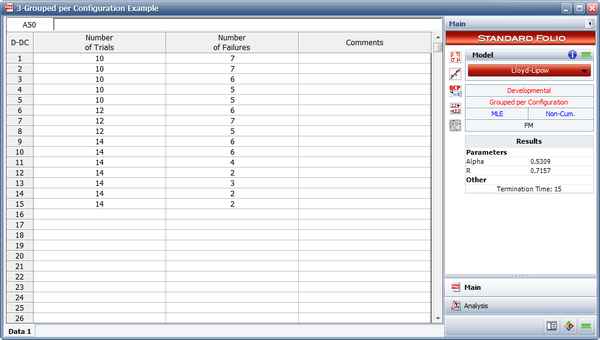
- The maximum achievable reliability as the number of test stages approaches infinity is equal to the value of [math]\displaystyle{ R\,\! }[/math]. Therefore, [math]\displaystyle{ R=0.7157\,\! }[/math].
- The maximum achievable reliability with a 90% confidence level can be estimated by viewing the confidence bounds on the parameters in the QCP, as shown in the figure below. The lower bound on the value of [math]\displaystyle{ R\,\! }[/math] is equal to 0.6691 .