Mixed Data - Crow-AMSAA Example
 |
New format available! This reference is now available in a new format that offers faster page load, improved display for calculations and images and more targeted search.
As of January 2024, this Reliawiki page will not continue to be updated. Please update all links and bookmarks to the latest references at RGA examples and RGA reference examples.
This example appears in the Reliability growth reference.
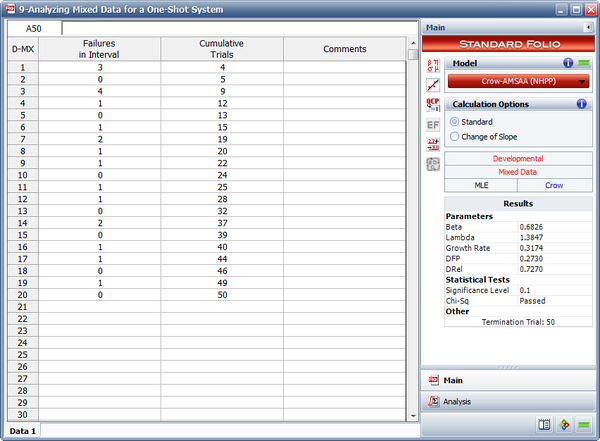
A one-shot system underwent reliability growth development for a total of 50 trials. The test was performed as a combination of configuration in groups and individual trial by trial. The table below shows the data set obtained from the test. The first column specifies the number of failures that occurred in each interval, and the second column shows the cumulative number of trials in that interval. Do the following:
- Estimate the parameters of the Crow-AMSAA model using maximum likelihood estimators.
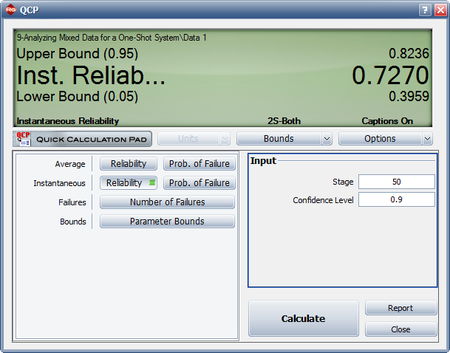
- What are the instantaneous reliability and the 2-sided 90% confidence bounds at the end of the test?
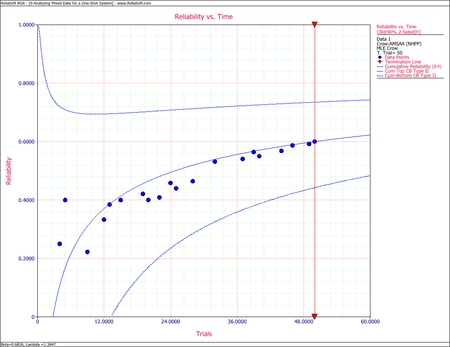
- Plot the cumulative reliability with 2-sided 90% confidence bounds.
- If the test was continued for another 25 trials what would the expected number of additional failures be?
| Failures in Interval | Cumulative Trials | Failures in Interval | Cumulative Trials |
|---|---|---|---|
| 3 | 4 | 1 | 25 |
| 0 | 5 | 1 | 28 |
| 4 | 9 | 0 | 32 |
| 1 | 12 | 2 | 37 |
| 0 | 13 | 0 | 39 |
| 1 | 15 | 1 | 40 |
| 2 | 19 | 1 | 44 |
| 1 | 20 | 0 | 46 |
| 1 | 22 | 1 | 49 |
| 0 | 24 | 0 | 50 |
Solution
- The next figure shows the parameters estimated using RGA.
- The figure below shows the calculation of the instantaneous reliability with the 2-sided 90% confidence bounds. From the QCP, it is estimated that the instantaneous reliability at stage 50 (or at the end of the test) is 72.70% with an upper and lower 2-sided 90% confidence bound of 82.36% and 39.59%, respectively.
- The following plot shows the cumulative reliability with the 2-sided 90% confidence bounds.
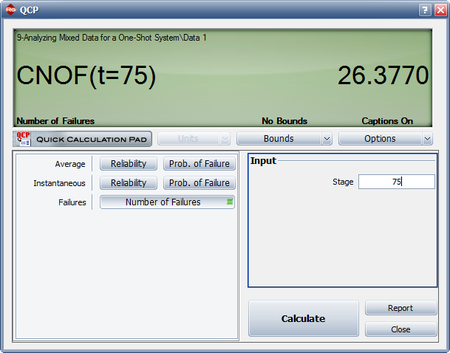
- The last figure shows the calculation of the expected number of failures after 75 trials. From the QCP, it is estimated that the cumulative number of failures after 75 trials is [math]\displaystyle{ 26.3770\approx 27\,\! }[/math]. Since 20 failures occurred in the first 50 trials, the estimated number of additional failures is 7.