RGA SimuMatic Example
 |
New format available! This reference is now available in a new format that offers faster page load, improved display for calculations and images and more targeted search.
As of January 2024, this Reliawiki page will not continue to be updated. Please update all links and bookmarks to the latest references at RGA examples and RGA reference examples.
This example appears in the Reliability growth reference.
A manufacturer wants to design a reliability growth test for a redesigned product, in order to achieve an MTBF of 1,000 hours. Simulation is chosen to estimate the 1-sided 90% confidence bound on the required time to achieve the goal MTBF of 1,000 hours and the 1-sided 90% lower confidence bound on the MTBF at the end of the test time. The total test time is expected to be 15,000 hours. Based on historical data for the previous version, the expected beta and lambda parameters of the test are 0.5 and 0.3, respectively. Do the following:
- Generate 1,000 data sets using SimuMatic along with the required output.
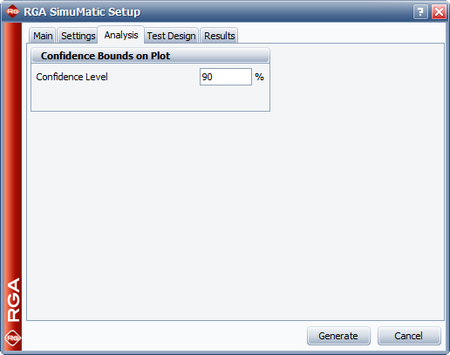
- Plot the instantaneous MTBF vs. time with the 90% confidence bounds.
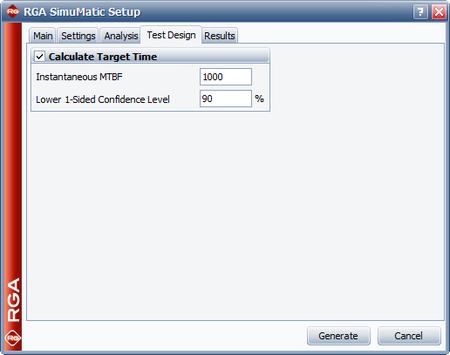
- Estimate the 1-sided 90% lower confidence bound on time for an MTBF of 1,000 hours.
- Estimate the 1-sided 90% lower confidence bound on the instantaneous MTBF at the end of the test.
Solution
- The next figure shows the SimuMatic window with all the appropriate inputs for creating the data sets.
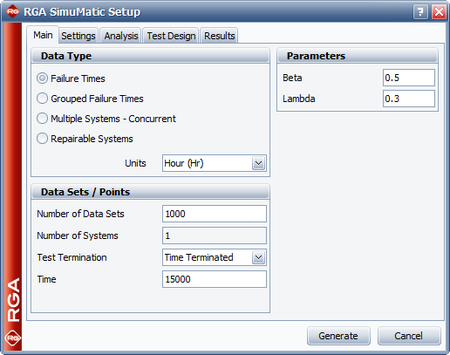
The next three figures show the settings in the Analysis, Test Design and Results tab of the SimuMatic window in order to obtain the desired outputs.
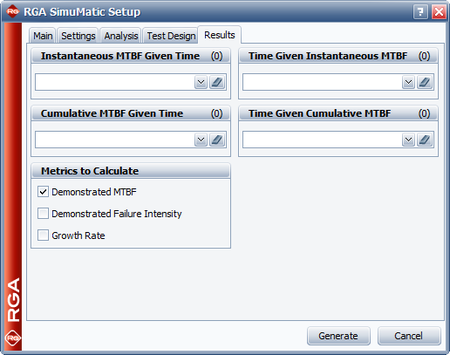
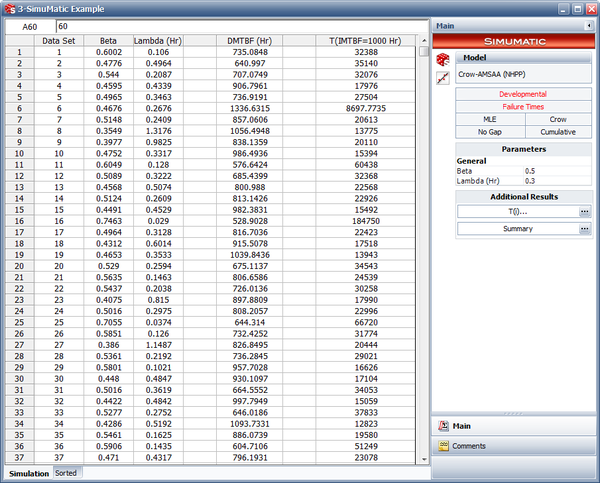
The following figure displays the results of the simulation. The columns labeled "Beta" and "Lambda" contain the different parameters obtained by calculating each data set generated via simulation for the 1,000 data sets. The "DMTBF" column contains the instantaneous MTBF at 15,000 hours (the end of test time), given the parameters obtained by calculating each data set generated via simulation. The "T(IMTBF=1000 Hr)" column contains the time required for the MTBF to reach 1,000 hours, given the parameters obtained from the simulation.
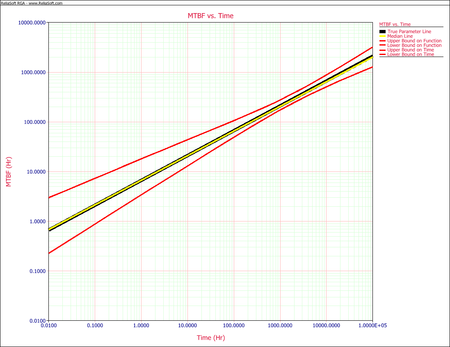
- The next figure shows the plot of the instantaneous MTBF with the 90% confidence bounds.
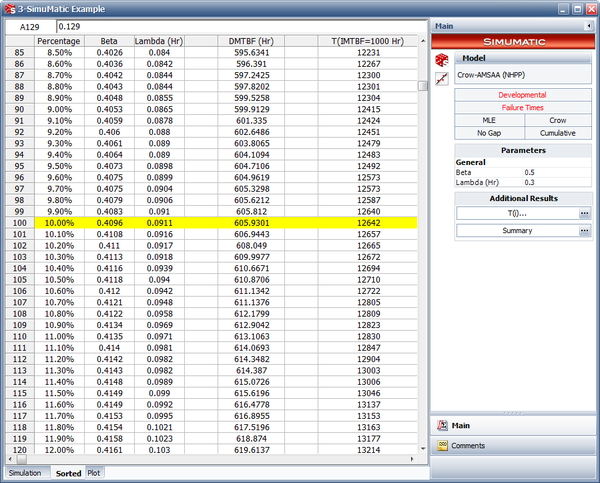
- The 1-sided 90% lower confidence bound on time, assuming MTBF = 1,000 hours, can be obtained from the results of the simulation. In the "Sorted" data sheet, this is the target DMTBF value that corresponds to 10.00%, as shown in the next figure. Therefore the 1-sided 90% lower confidence bound on time is 12,642.21 hours.
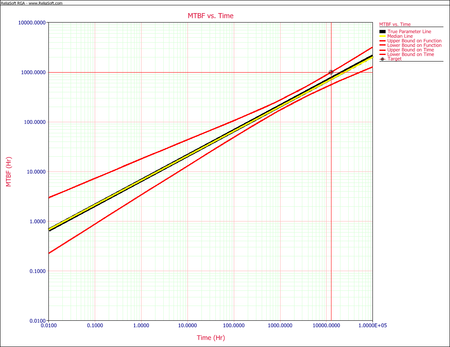
- The next figure shows the 1-sided 90% lower confidence bound on time in the instantaneous MTBF plot. This is indicated by the target lines on the plot.
- The 1-sided 90% lower confidence bound on the instantaneous MTBF at the end of the test is again obtained from the "Sorted" data sheet by looking at the value in the "IMTBF(15,000)" column that corresponds to 10.00%. As seen in the simulation results shown above, the 1-sided 90% lower confidence bound on the instantaneous MTBF at the end of the test is 605.93 hours.