Reliability Data - Lloyd-Lipow Model
Jump to navigation
Jump to search
 |
New format available! This reference is now available in a new format that offers faster page load, improved display for calculations and images and more targeted search.
As of January 2024, this Reliawiki page will not continue to be updated. Please update all links and bookmarks to the latest references at RGA examples and RGA reference examples.
This example appears in the Reliability growth reference.
Given the reliability data in the table below, do the following:
- Fit the Lloyd-Lipow model to the data using least squares analysis.
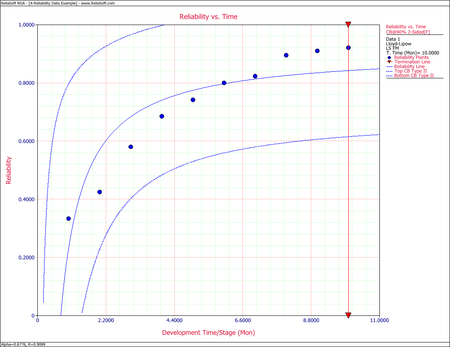
- Plot the Lloyd-Lipow reliability with 90% 2-sided confidence bounds.
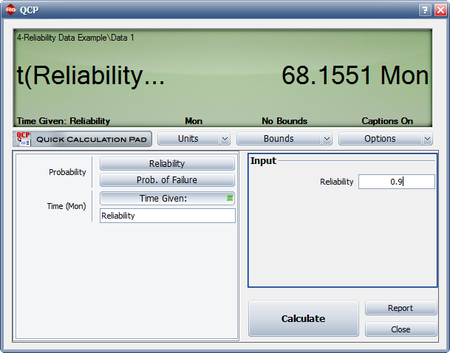
- How many months of testing are required to achieve a reliability goal of 90%?
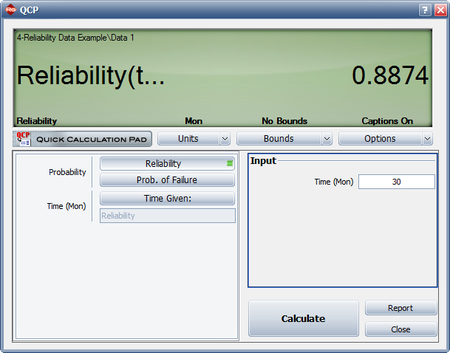
- What is the attainable reliability if the maximum duration of testing is 30 months?
| Time (months) | Reliability (%) |
|---|---|
| 1 | 33.35 |
| 2 | 42.50 |
| 3 | 58.02 |
| 4 | 68.50 |
| 5 | 74.20 |
| 6 | 80.00 |
| 7 | 82.30 |
| 8 | 89.50 |
| 9 | 91.00 |
| 10 | 92.10 |
Solution
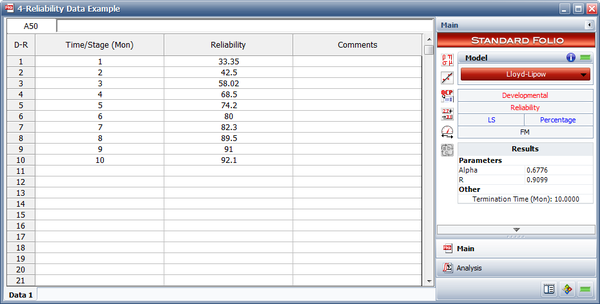
- The next figure displays the estimated parameters.
- The figure below displays Reliability vs. Time plot with 90% 2-sided confidence bounds.
- The next figure shows the number of months of testing required to achieve a reliability goal of 90%.
- The figure below displays the reliability achieved after 30 months of testing.