Uploads by Dingzhou Cao
Jump to navigation
Jump to search
This special page shows all uploaded files.
| Date | Name | Thumbnail | Size | Description | Versions |
|---|---|---|---|---|---|
| 16:14, 26 November 2012 | 6.15.png (file) |  |
8 KB | 1 | |
| 22:44, 19 March 2012 | BS4-30.png (file) |  |
41 KB | 1 | |
| 16:51, 19 March 2012 | Anlytical FRED example.png (file) |  |
7 KB | 1 | |
| 16:22, 19 March 2012 | Report example2 WorkBook.png (file) |  |
26 KB | 1 | |
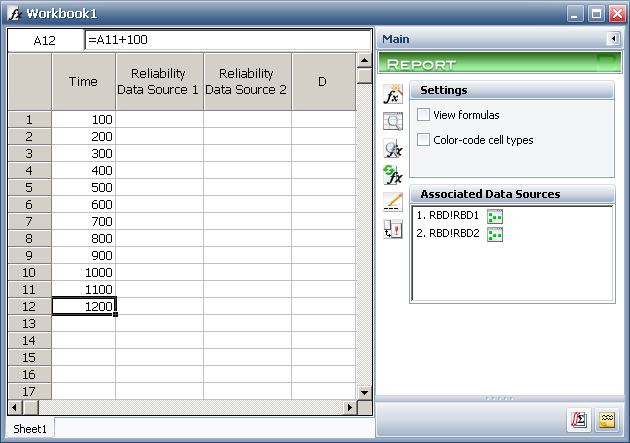
| 16:19, 19 March 2012 | Report example1 WorkBook.png (file) |  |
23 KB | 1 | |
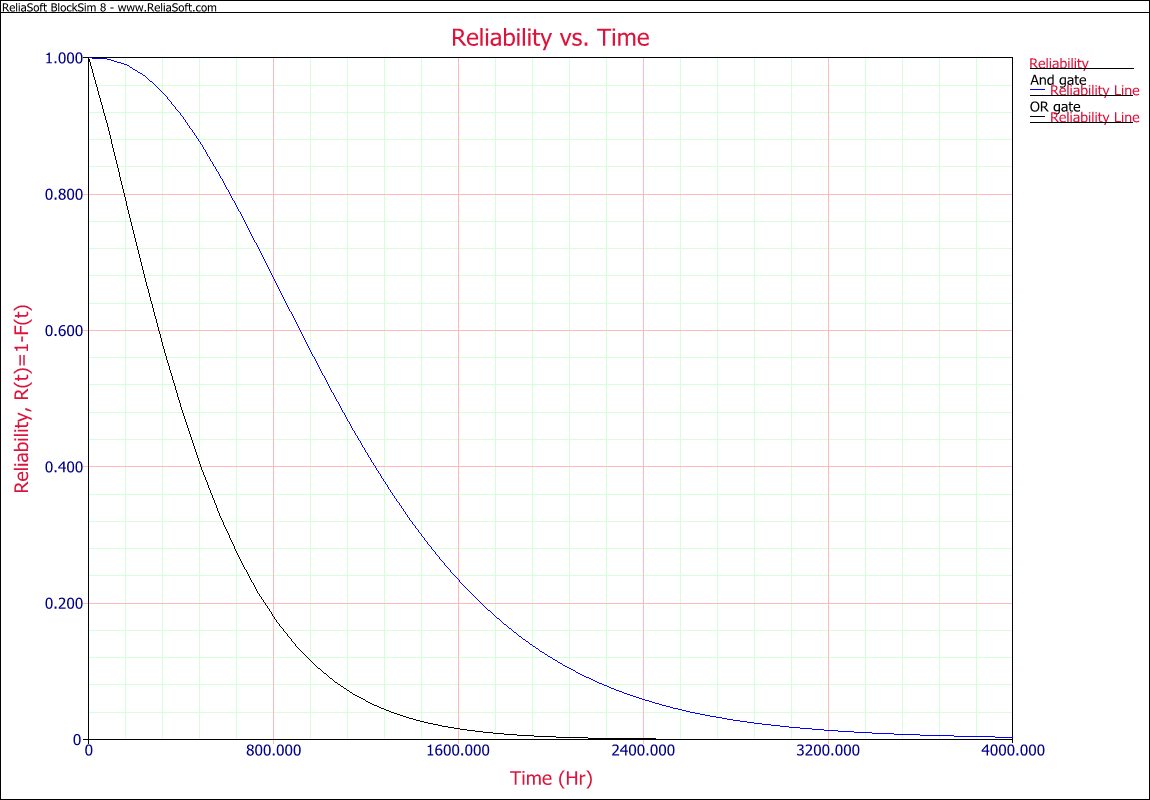
| 23:54, 8 March 2012 | Overlay plot - Reliability vs Time.png (file) |  |
67 KB | 1 | |
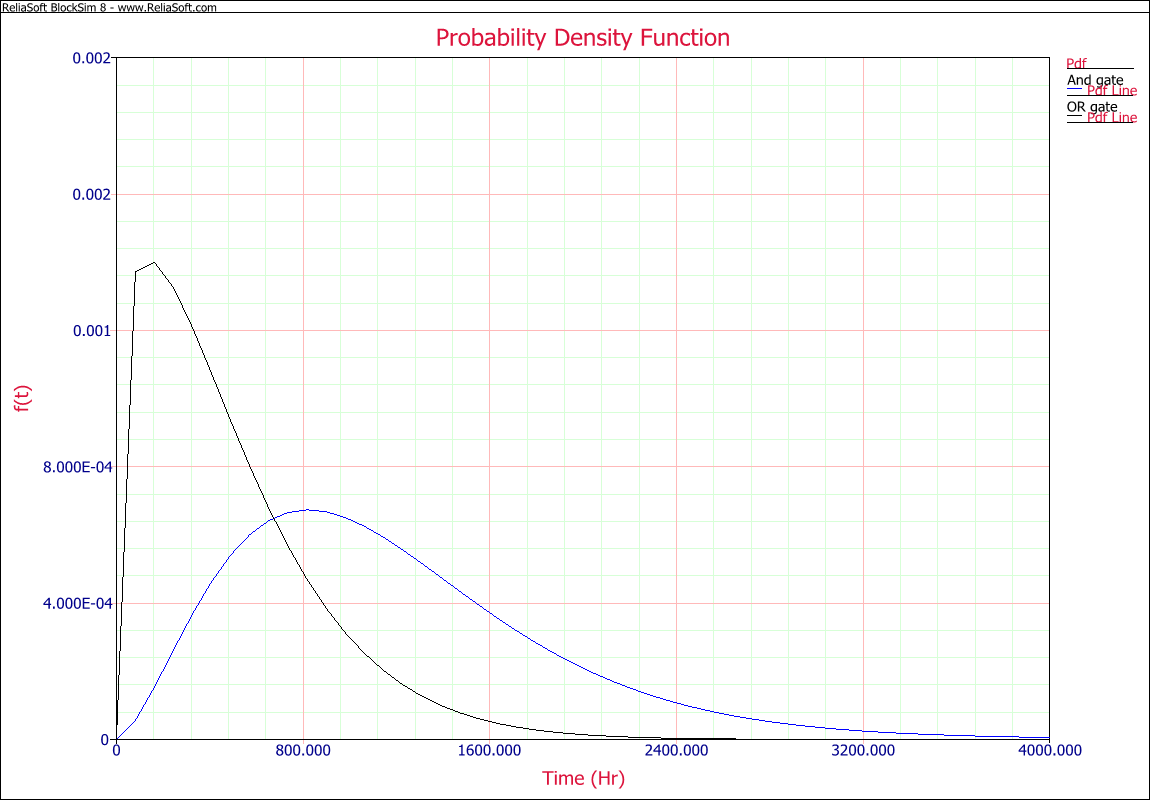
| 23:52, 8 March 2012 | Overlay plot - PDF.png (file) |  |
70 KB | 1 | |
| 23:48, 8 March 2012 | Overlay plot.png (file) |  |
19 KB | 1 | |
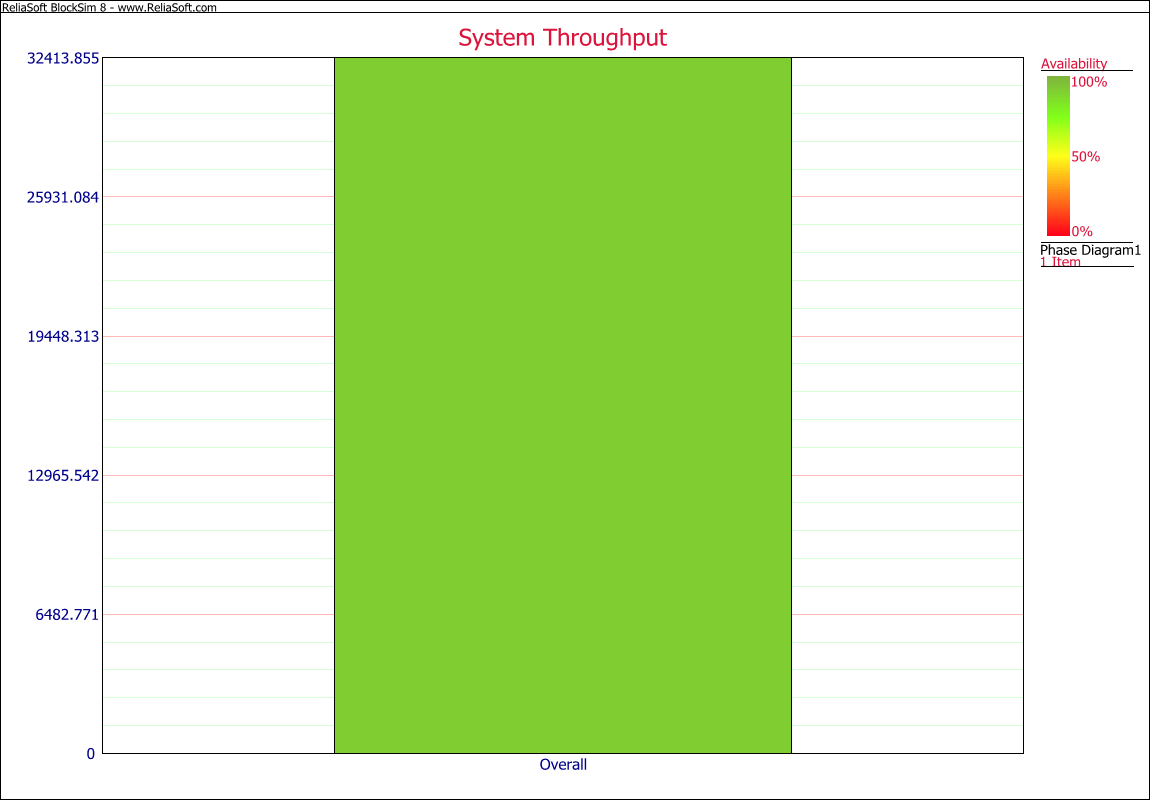
| 23:16, 8 March 2012 | Oil Refineary - System Throughput plot.png (file) |  |
46 KB | 1 | |
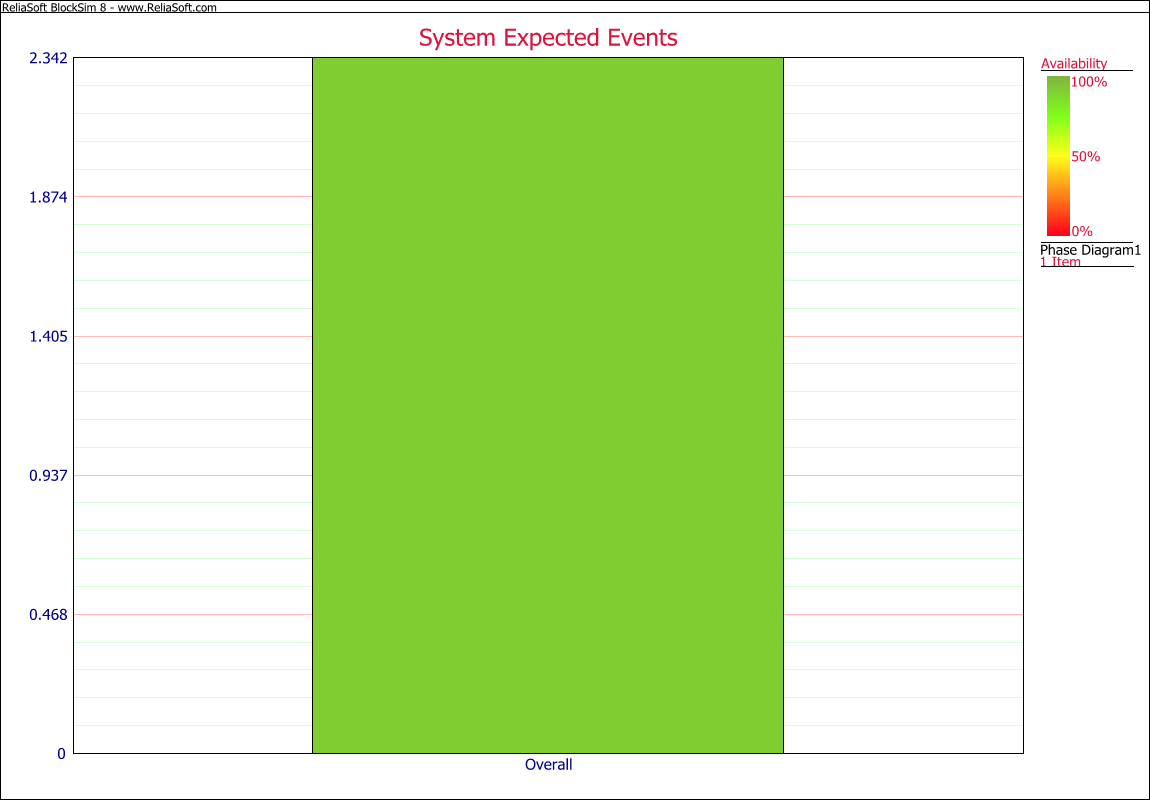
| 23:15, 8 March 2012 | Oil Refineary - System Expected Dowing Events plot.png (file) |  |
45 KB | 1 | |
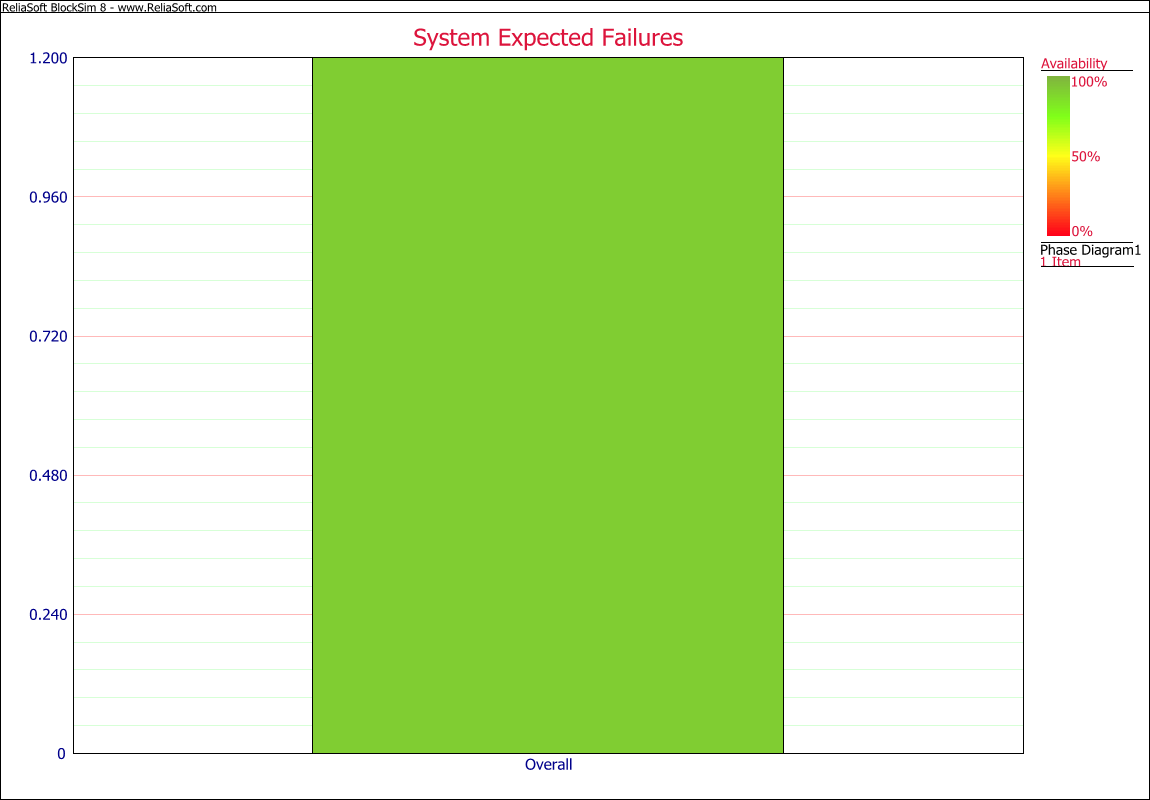
| 23:14, 8 March 2012 | Oil Refineary - System Expected Failure plot.png (file) |  |
45 KB | 1 | |
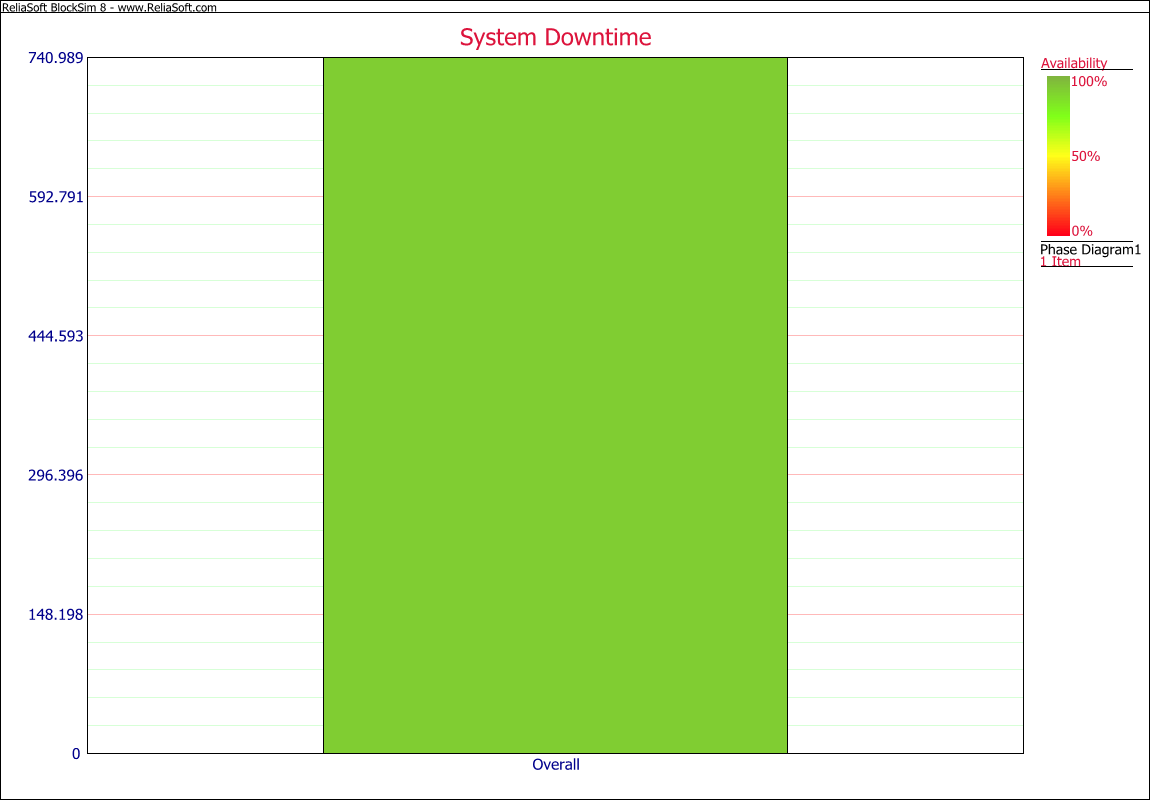
| 23:13, 8 March 2012 | Oil Refineary - System Down Time plot.png (file) |  |
46 KB | 1 | |
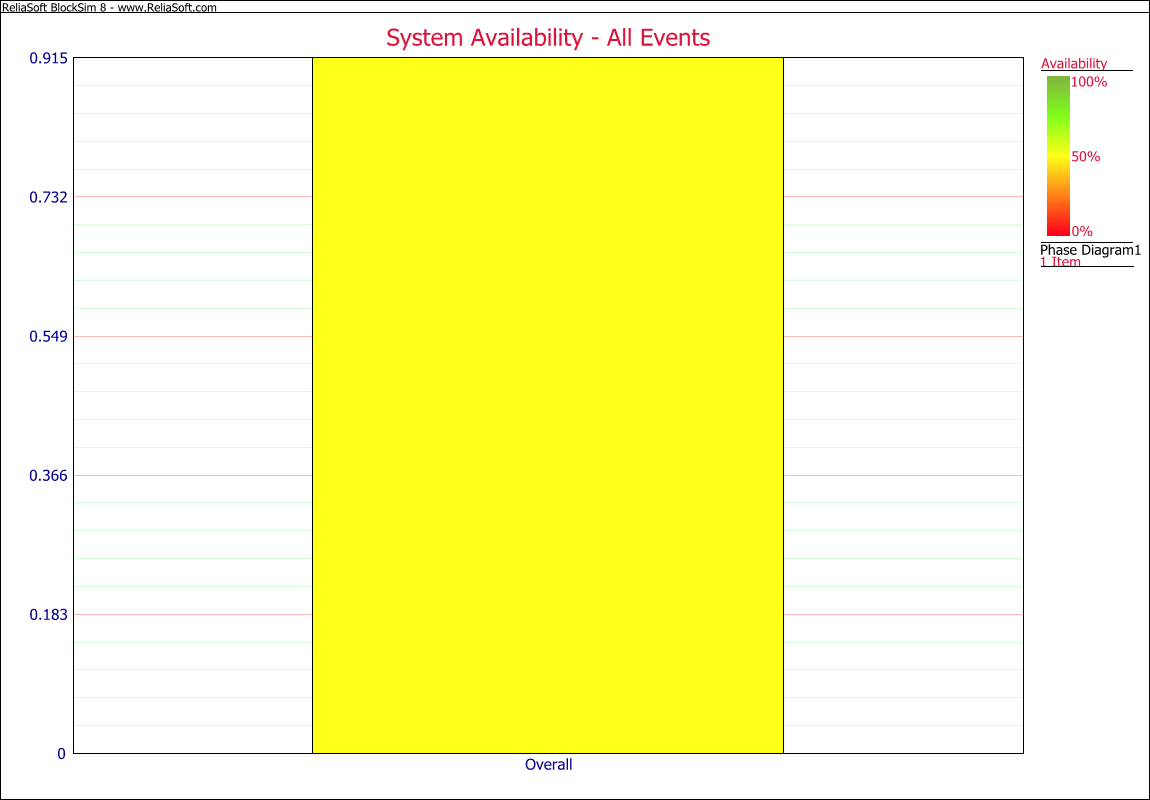
| 23:12, 8 March 2012 | Oil Refineary - System Availability all event plot.png (file) |  |
46 KB | 1 | |
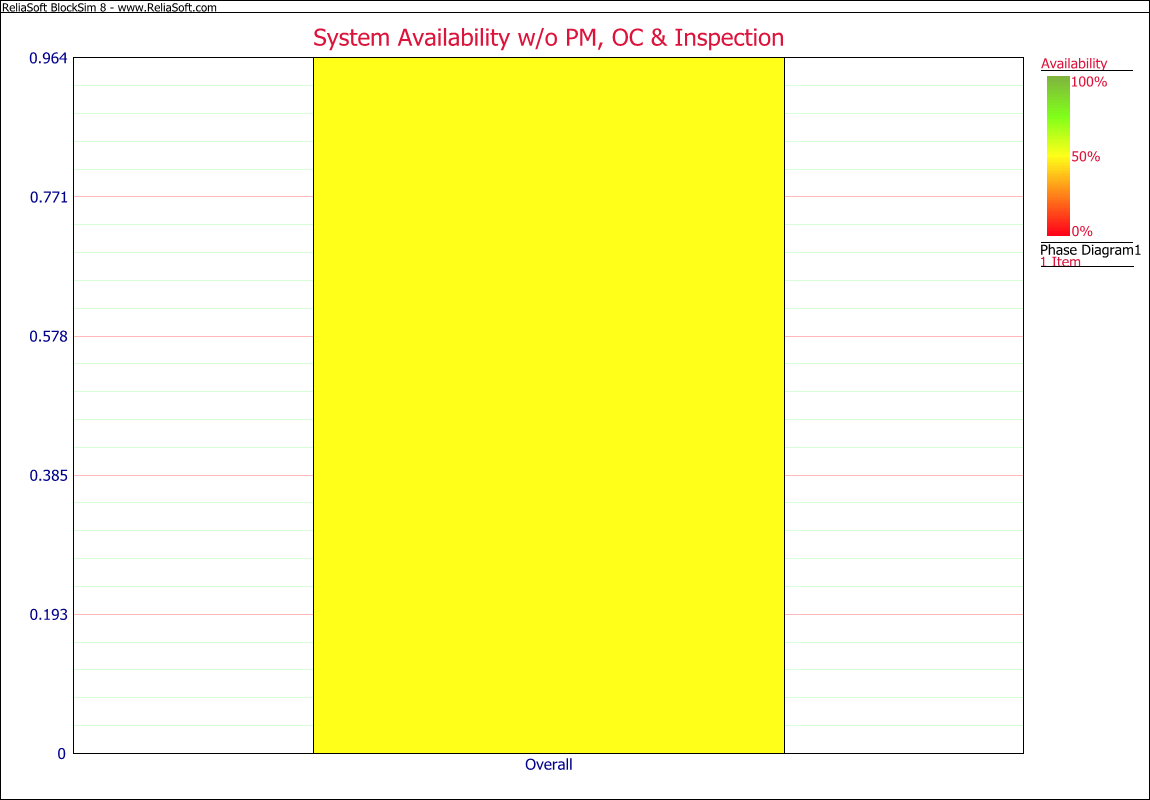
| 23:12, 8 March 2012 | Oil Refineary - System Availability plot.png (file) |  |
48 KB | 1 | |
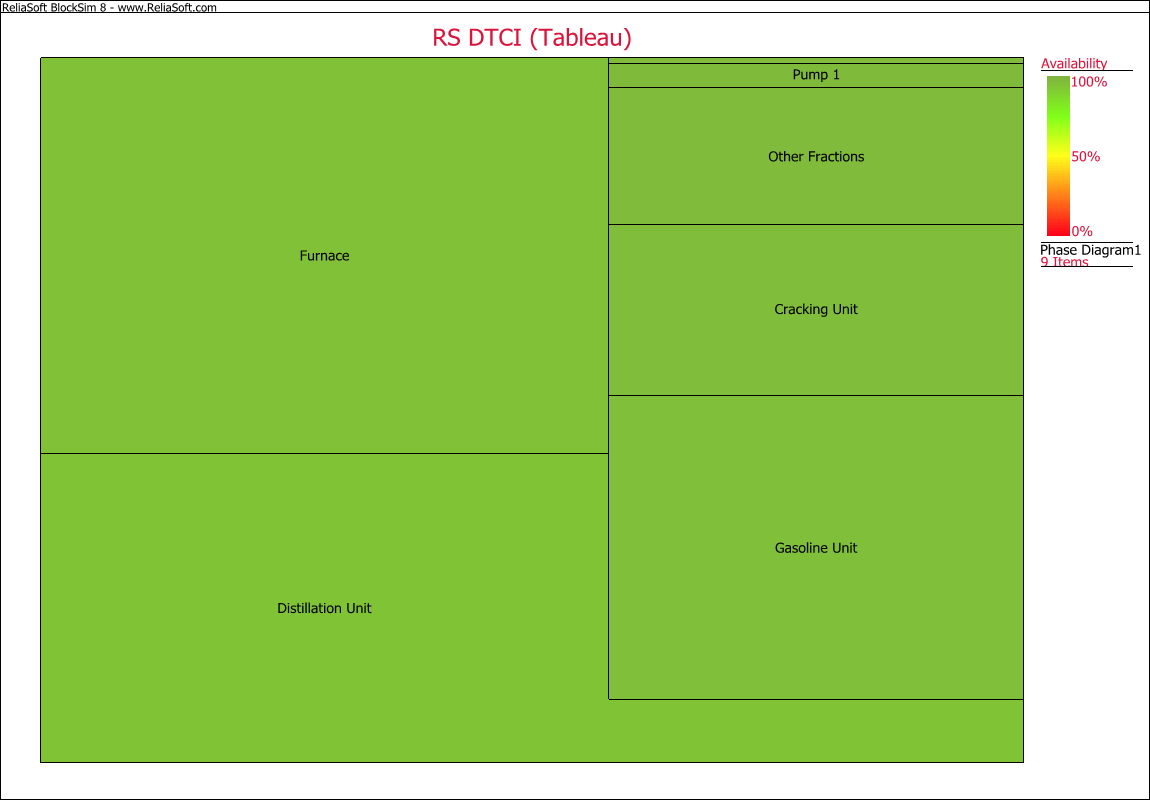
| 23:07, 8 March 2012 | Oil Refineary - RS DTCI (Tableau) plot.png (file) | _plot.png) |
43 KB | 1 | |
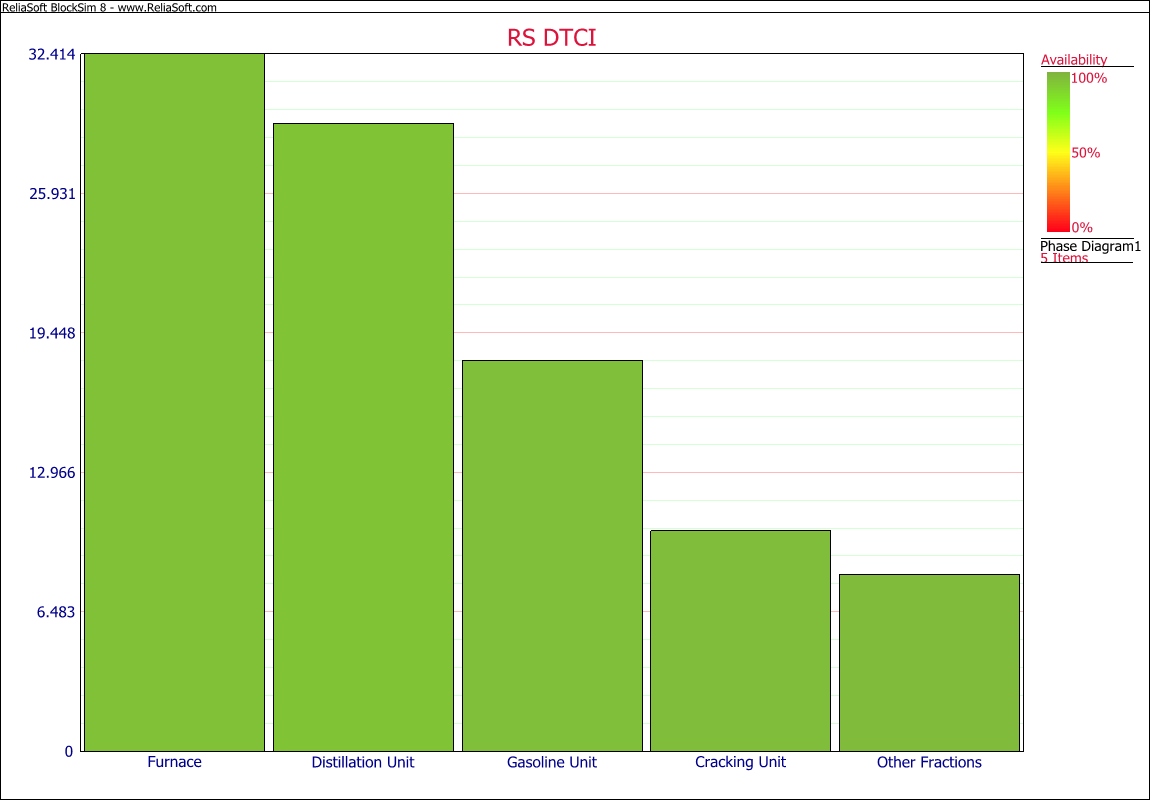
| 23:06, 8 March 2012 | Oil Refineary - RS DTCI plot.png (file) |  |
50 KB | 1 | |
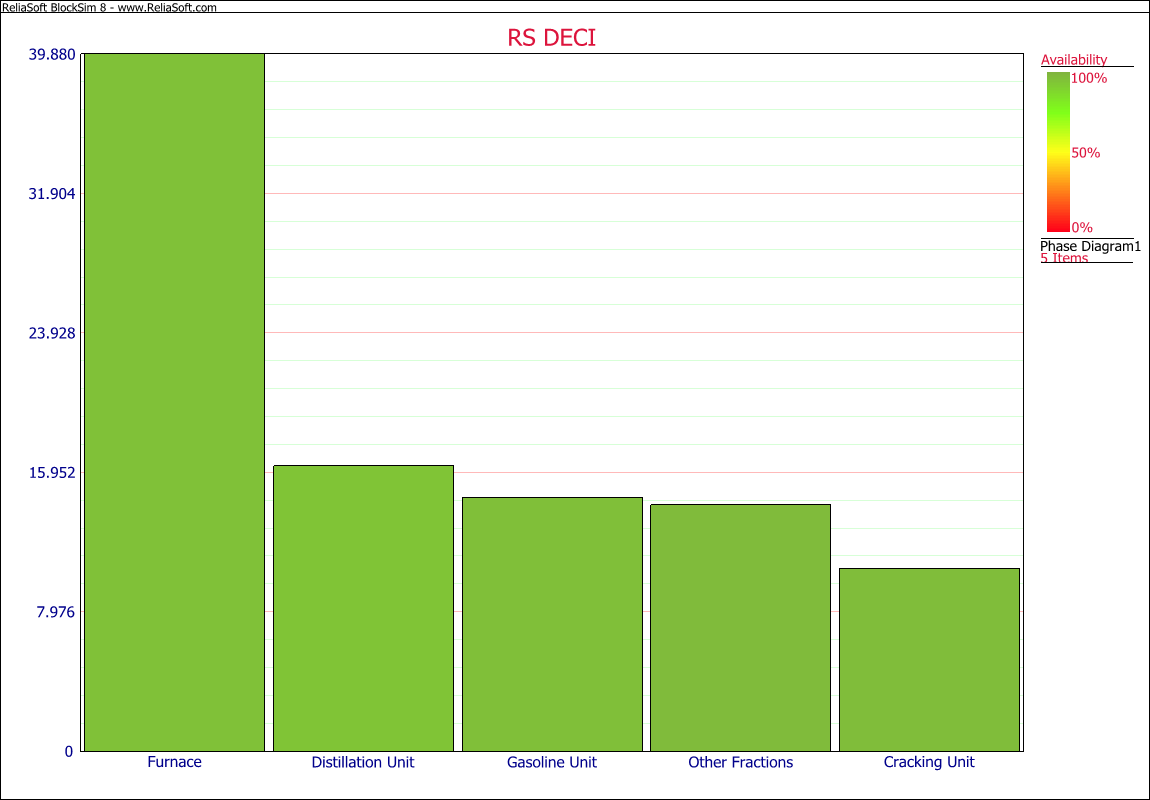
| 23:05, 8 March 2012 | Oil Refineary - RS DECI plot.png (file) |  |
47 KB | 1 | |
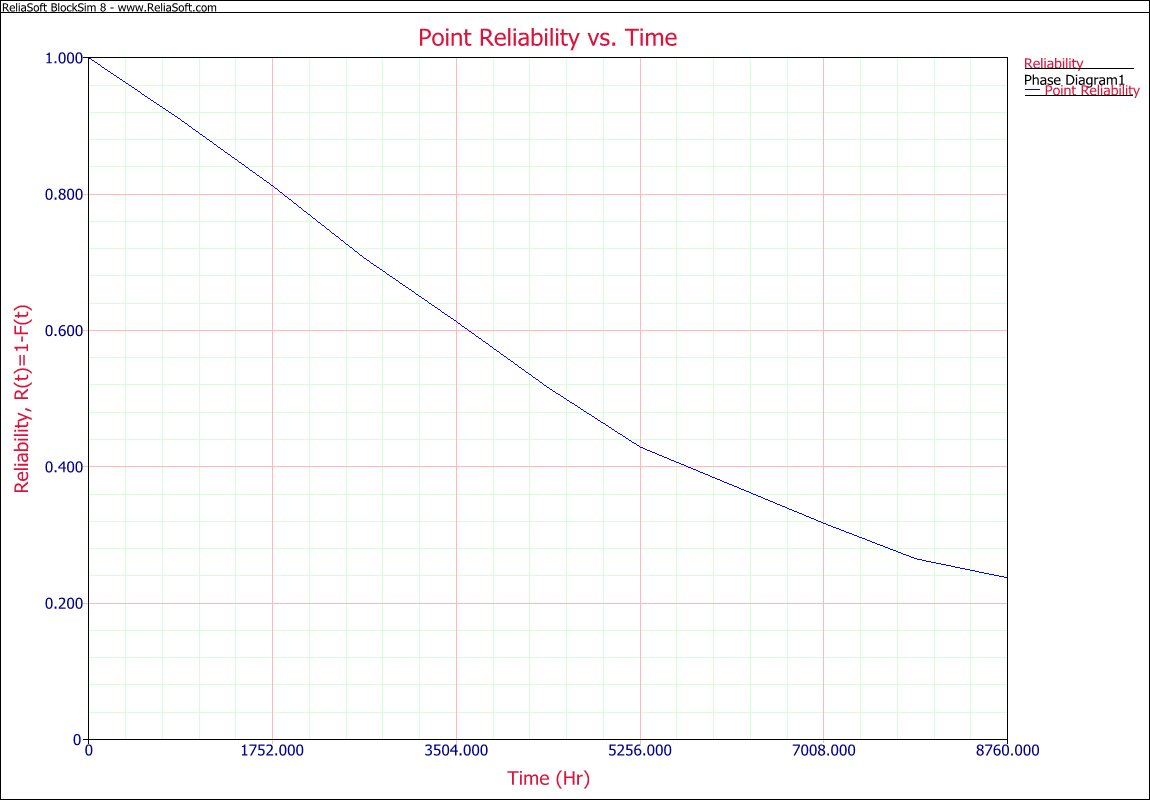
| 23:01, 8 March 2012 | Oil Refineary - Point Reliability plot.png (file) |  |
67 KB | 1 | |
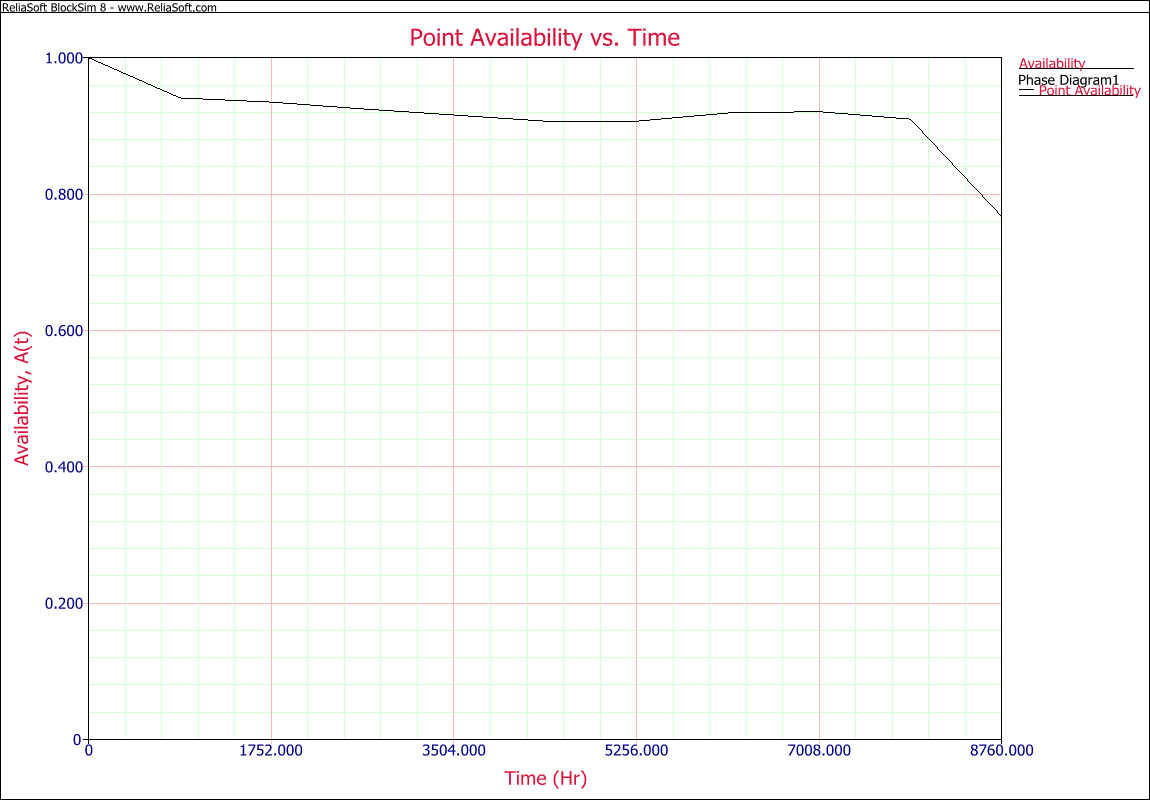
| 22:59, 8 March 2012 | Oil Refineary - Point Availability plot.png (file) |  |
63 KB | 2 | |
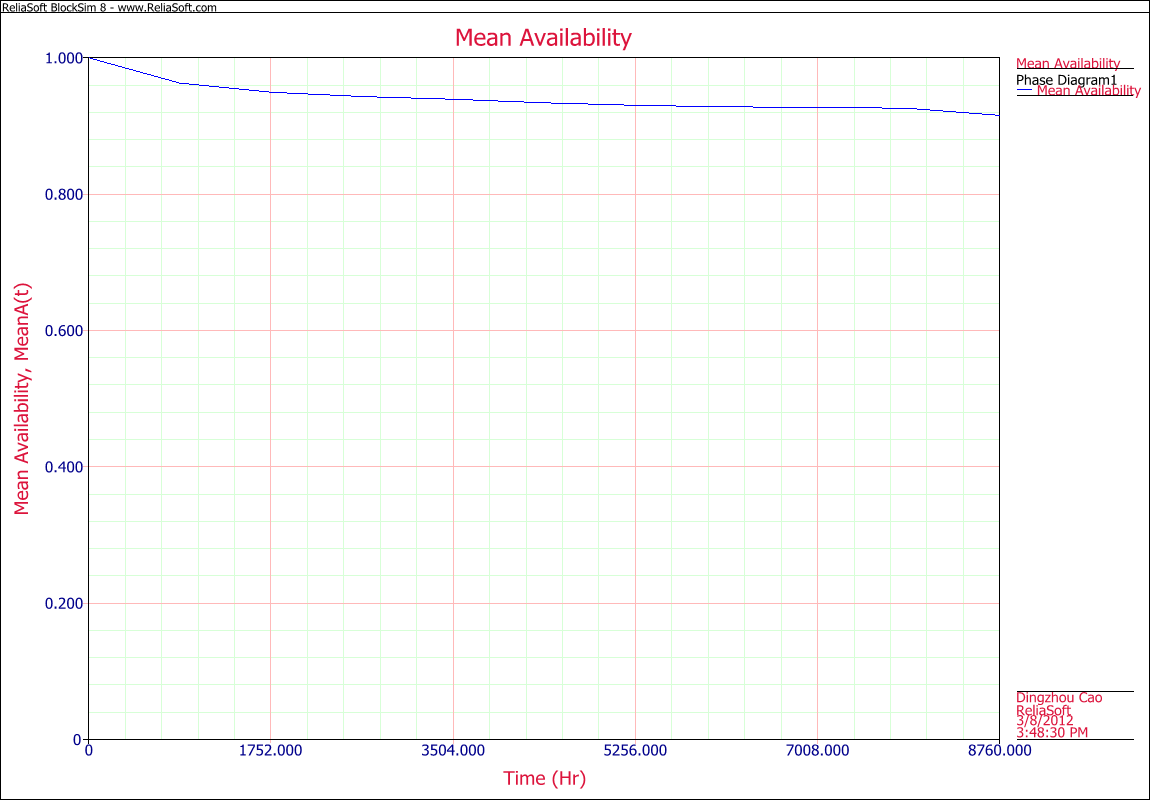
| 22:58, 8 March 2012 | Mean Availability.png (file) |  |
70 KB | 2 | |
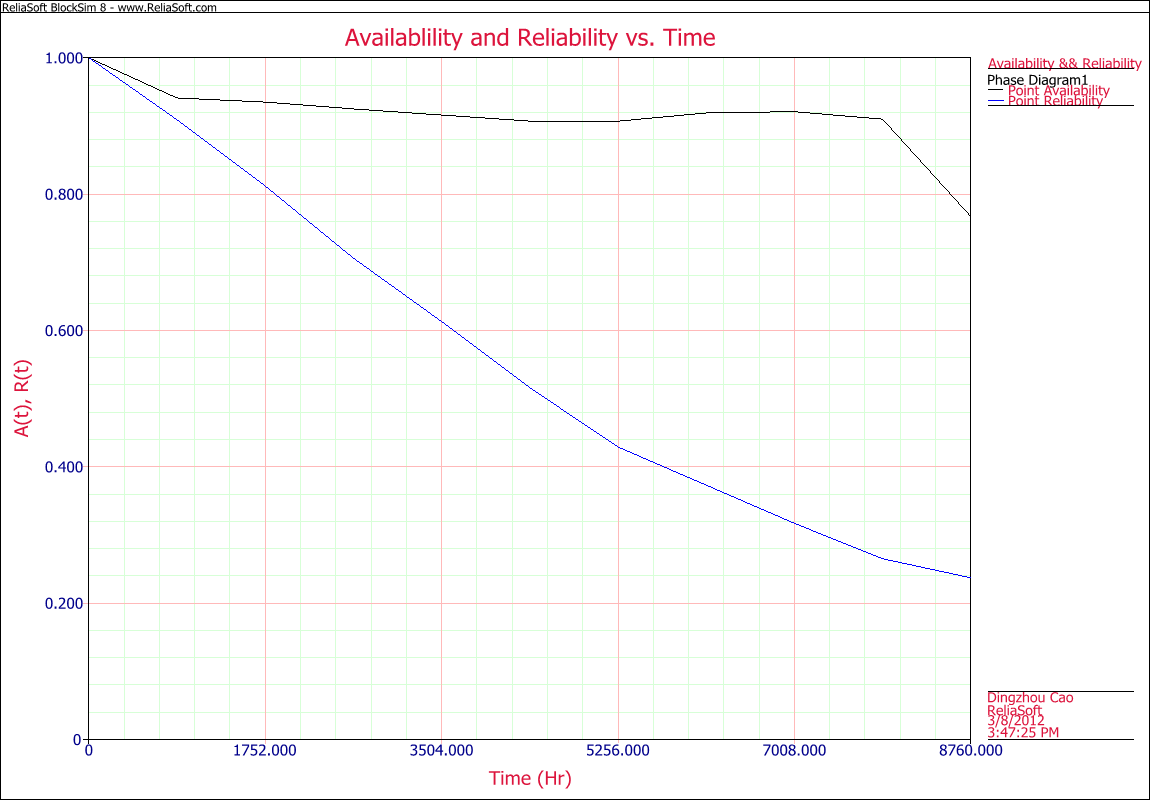
| 22:57, 8 March 2012 | Oil Refineary - AR vs. Time plot.png (file) |  |
68 KB | 2 | |
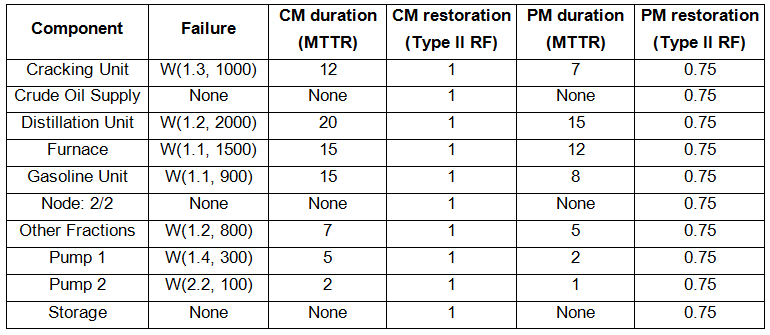
| 22:00, 8 March 2012 | Table for oil refinery.png (file) |  |
24 KB | 1 | |
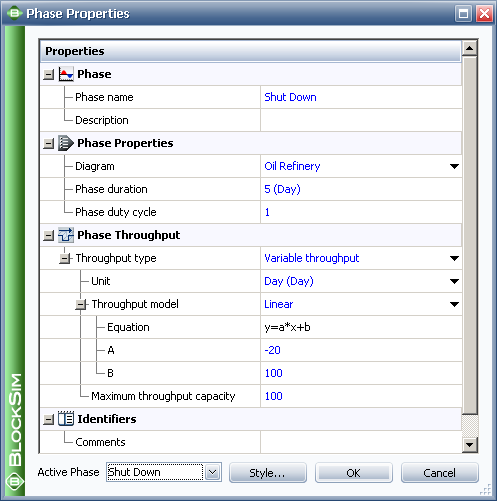
| 22:00, 8 March 2012 | Shut down phase properties for oil refinery.png (file) |  |
25 KB | 1 | |
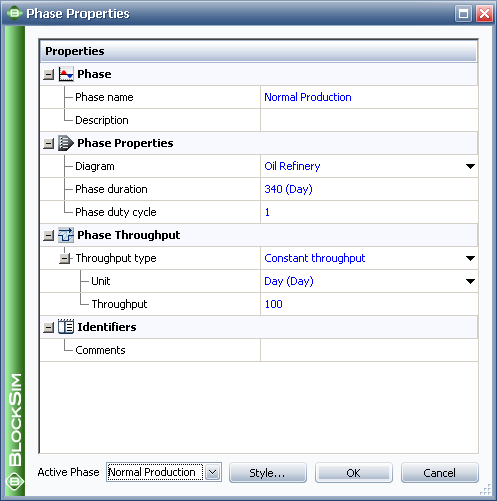
| 21:59, 8 March 2012 | Nornal Production phase properties for oil refinery.png (file) |  |
23 KB | 1 | |
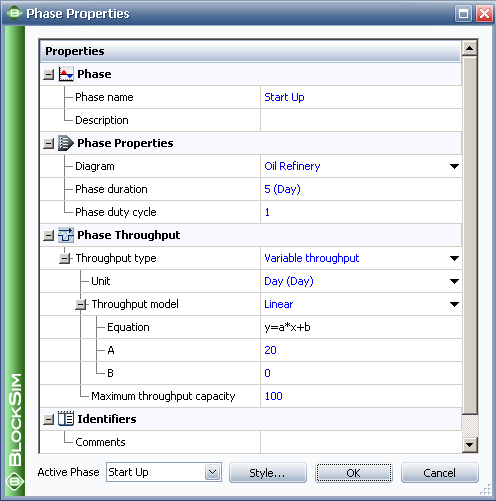
| 21:57, 8 March 2012 | Start Up phase properties for oil refinery.png (file) |  |
25 KB | 1 | |
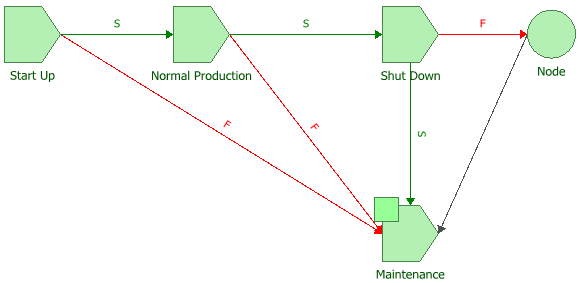
| 21:56, 8 March 2012 | Phase diagram for oil refinery.png (file) |  |
12 KB | 1 | |
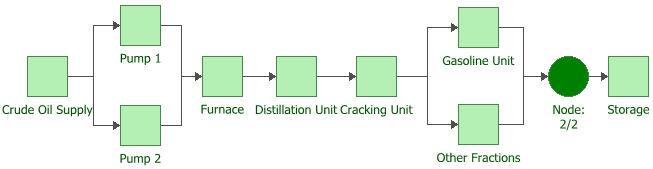
| 21:56, 8 March 2012 | RBD for oil refinery.png (file) | 12 KB | 3 | ||
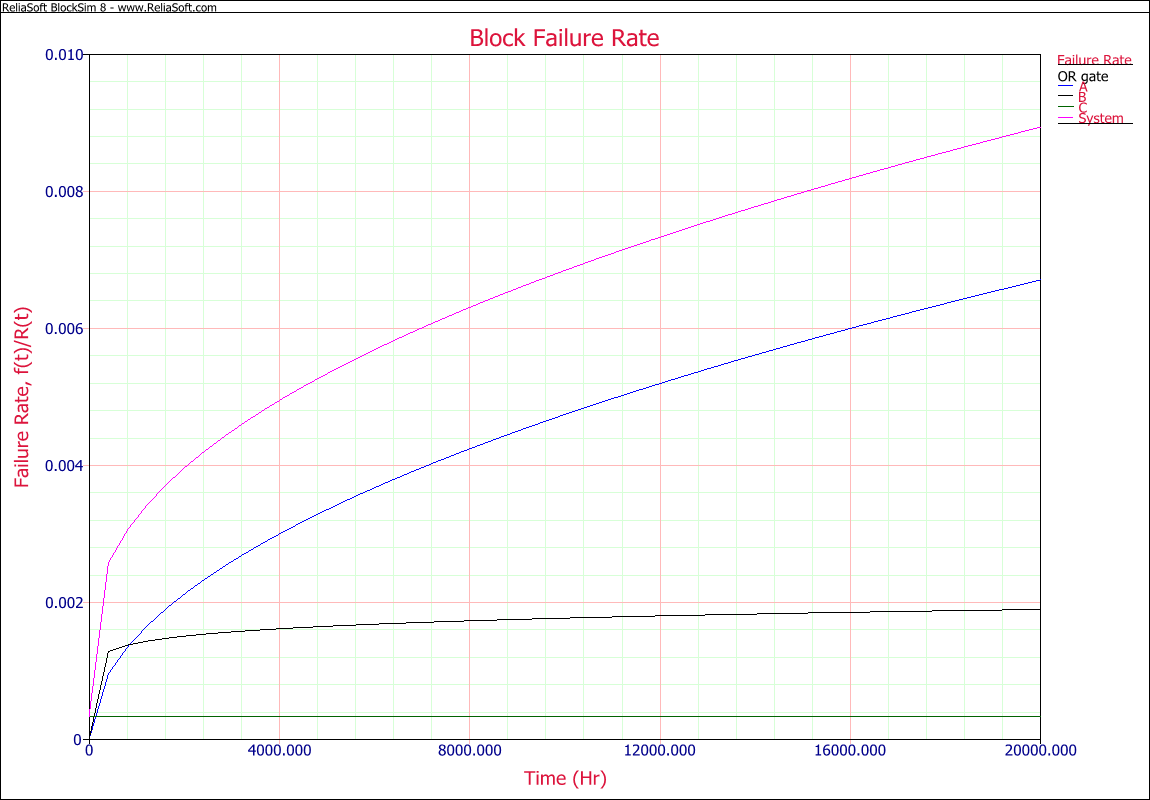
| 20:52, 8 March 2012 | Block Failure Rate.png (file) |  |
66 KB | 1 | |
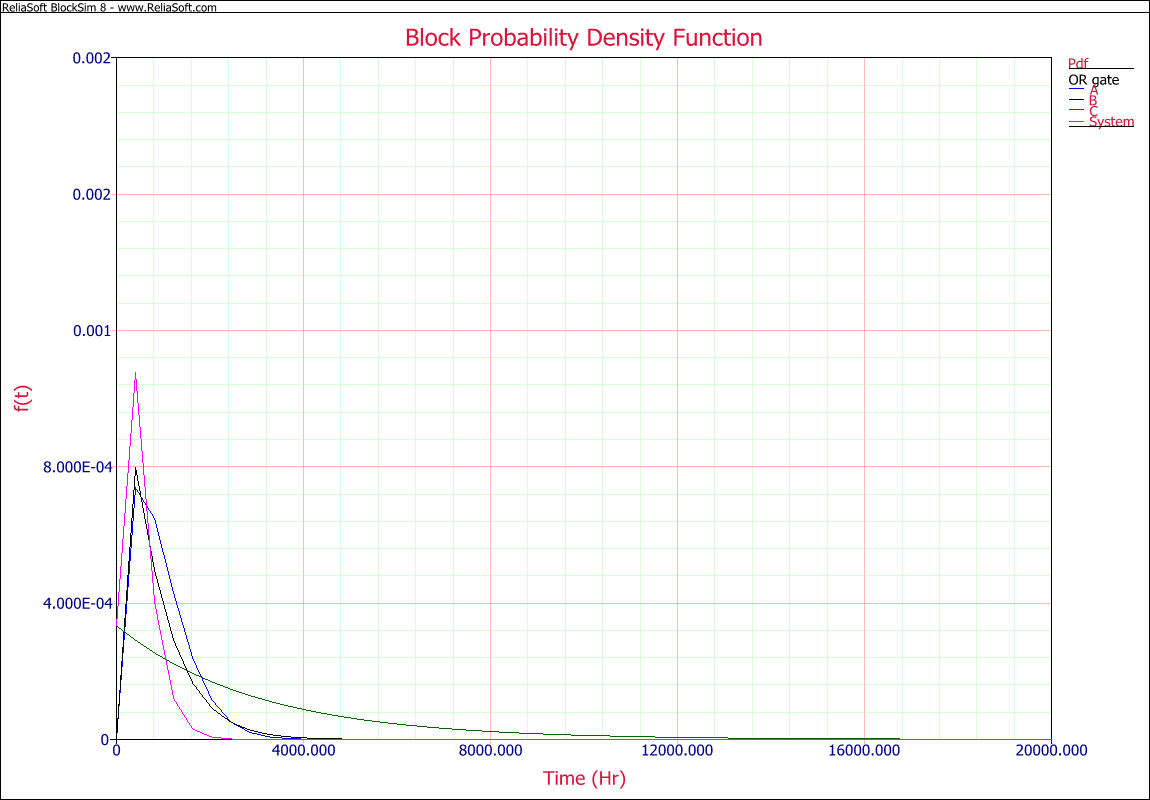
| 20:51, 8 March 2012 | Block Probability Density Function.png (file) |  |
67 KB | 1 | |
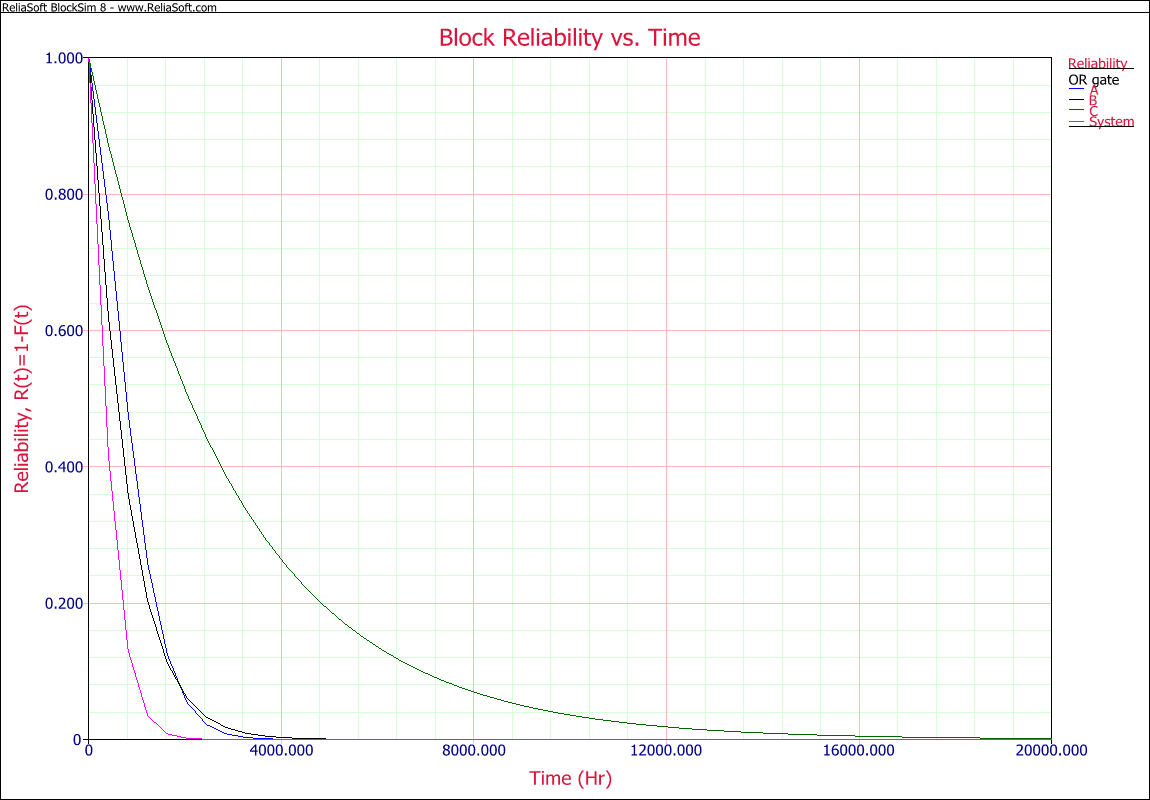
| 20:47, 8 March 2012 | Block Reliability vs. Time.png (file) |  |
70 KB | 1 | |
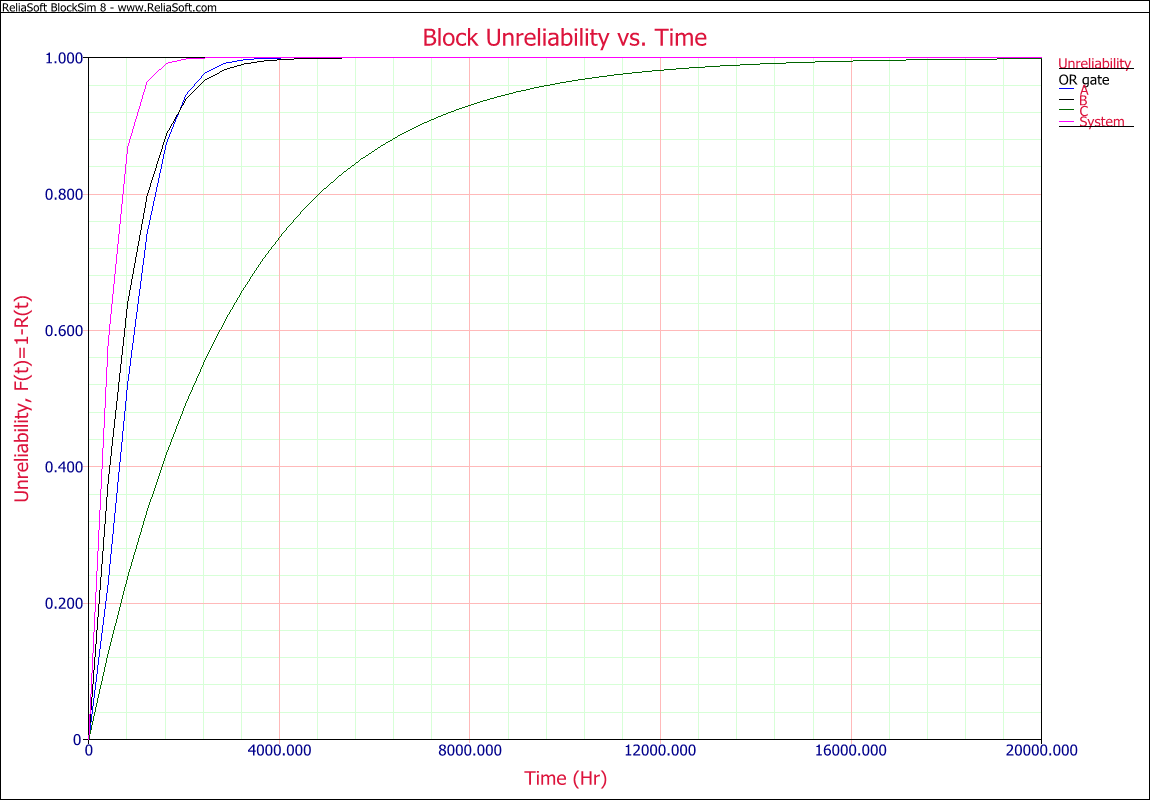
| 20:46, 8 March 2012 | Block Unreliability vs. Time.png (file) |  |
68 KB | 1 | |
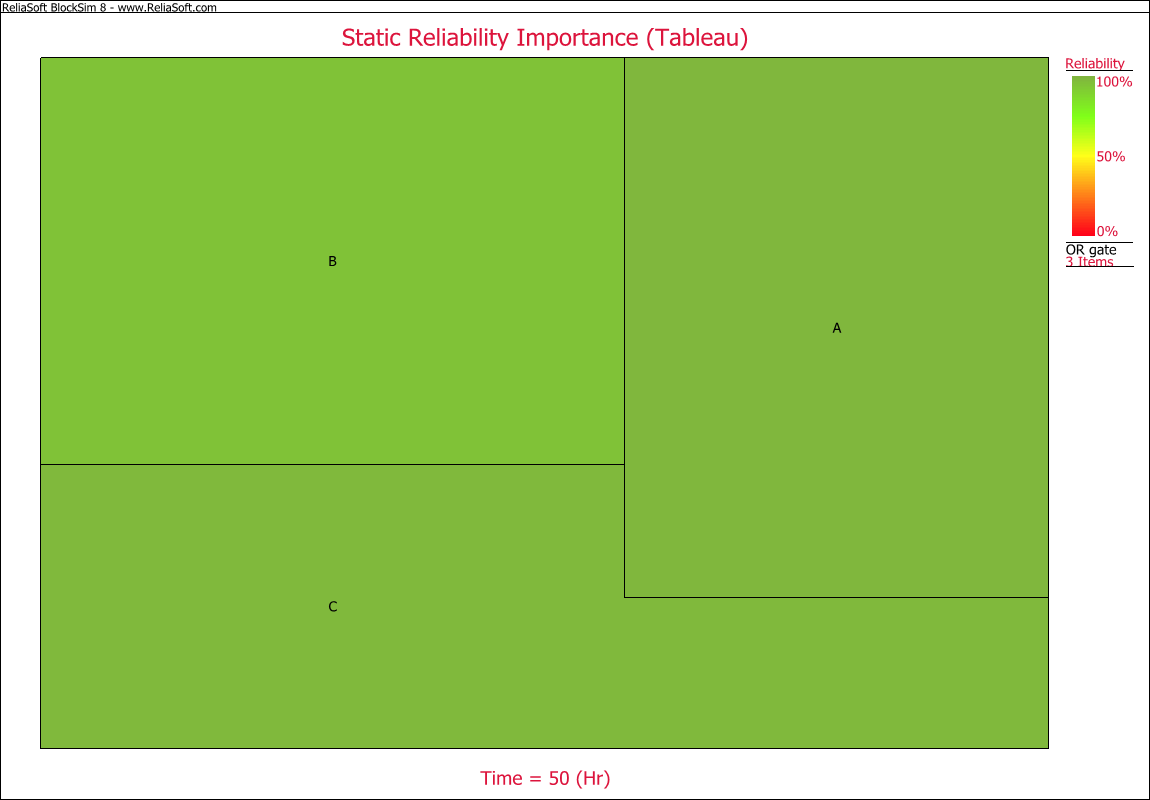
| 20:44, 8 March 2012 | Static Reliability Importance (Tableau).png (file) | .png) |
41 KB | 1 | |
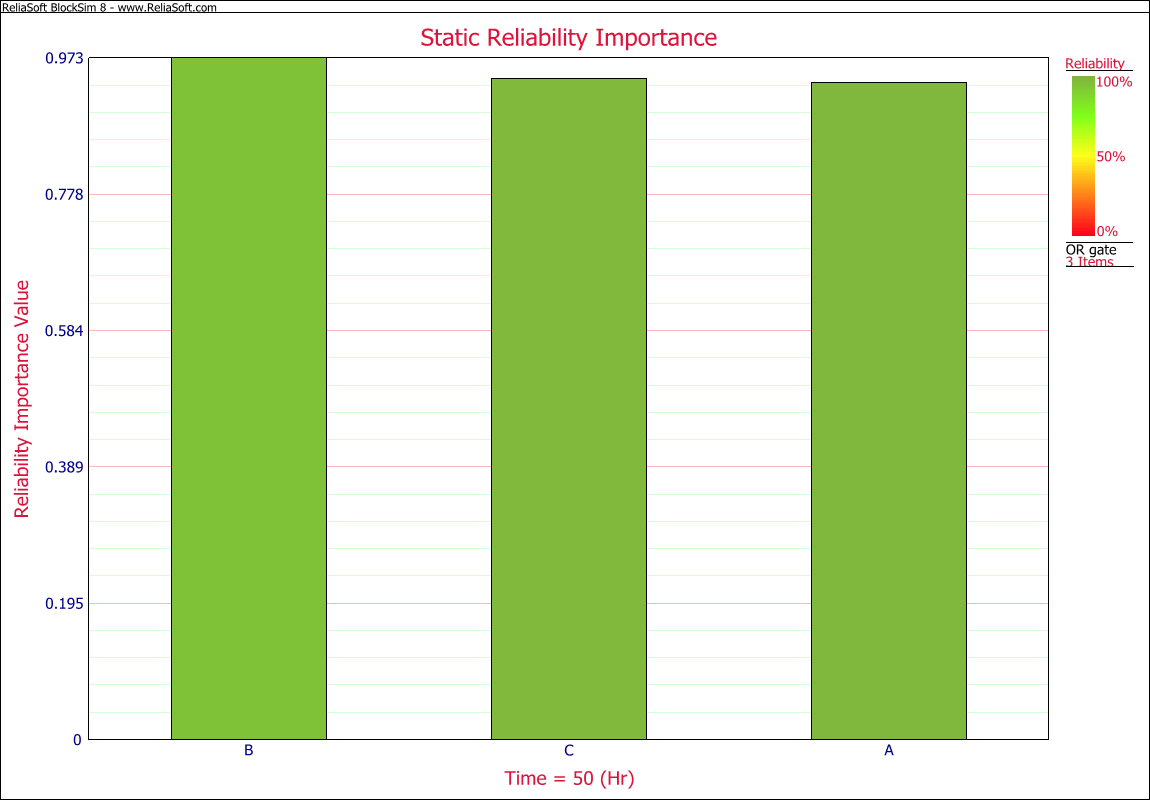
| 20:43, 8 March 2012 | Static Reliability Importance.png (file) |  |
55 KB | 1 | |
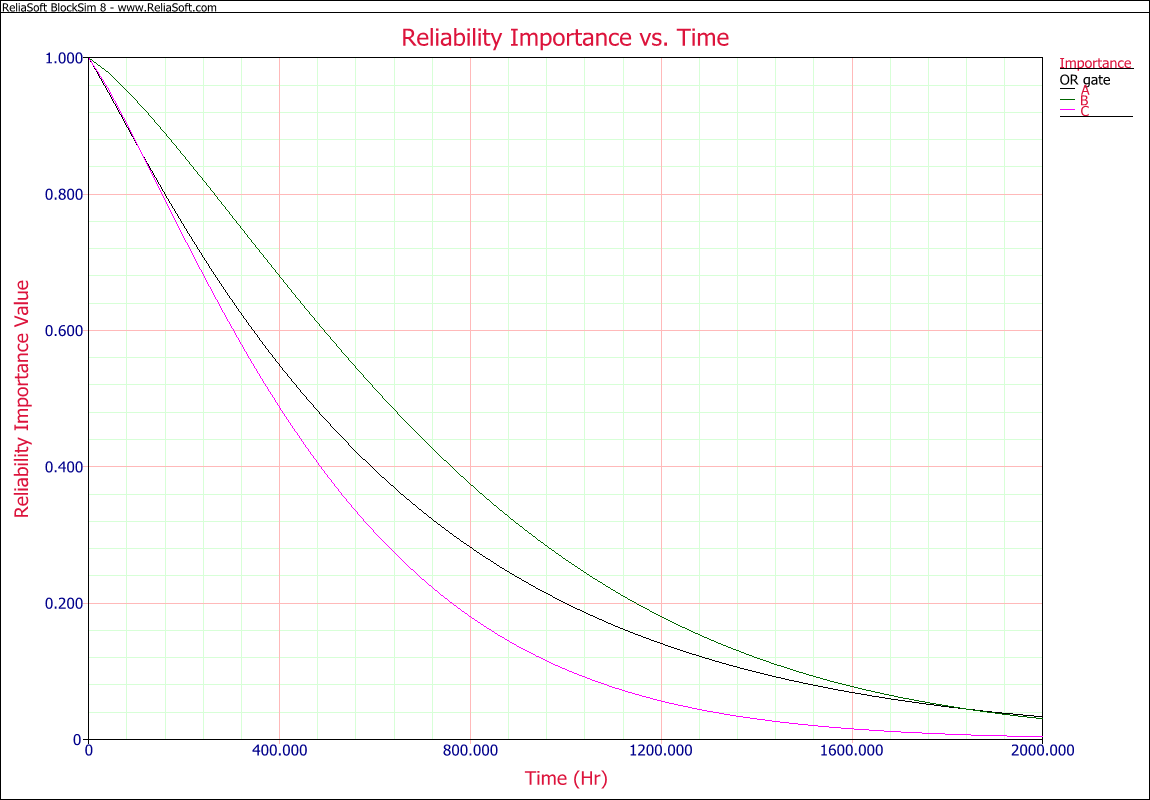
| 20:38, 8 March 2012 | Reliability Importance vs Time.png (file) |  |
74 KB | 1 | |
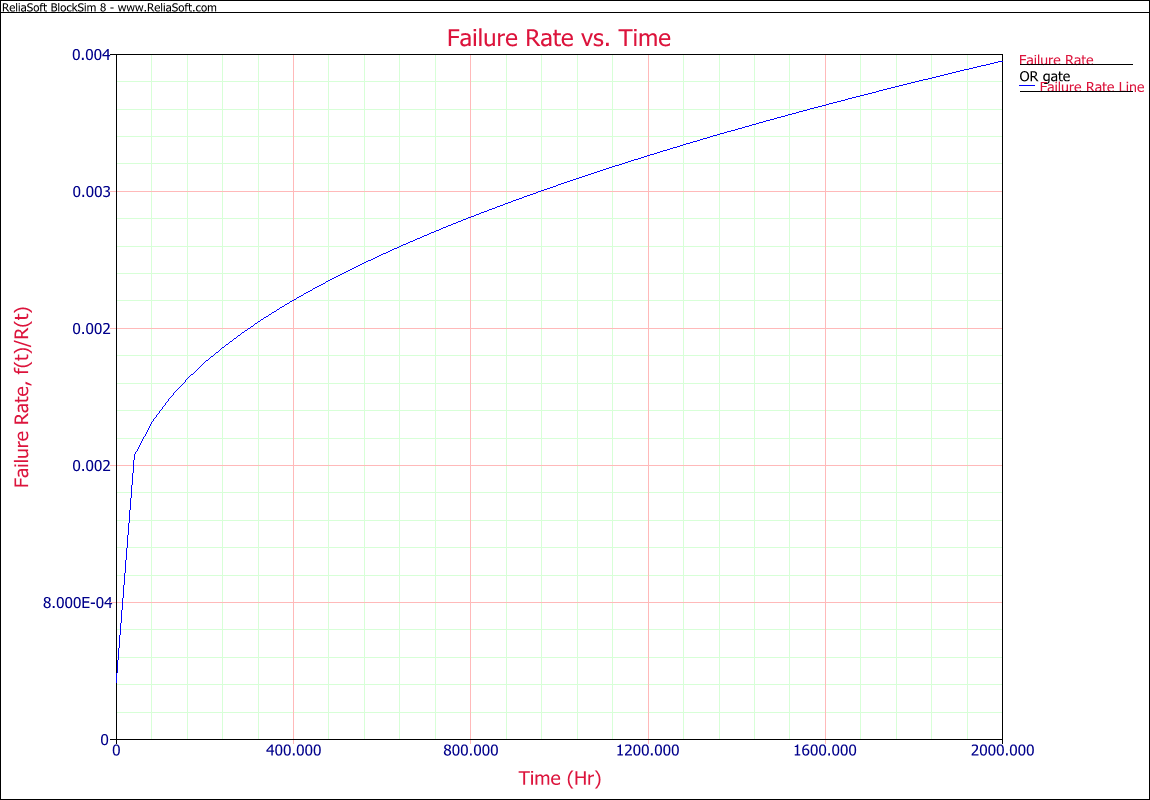
| 20:33, 8 March 2012 | Failure Rate VS Time.png (file) |  |
64 KB | 1 | |
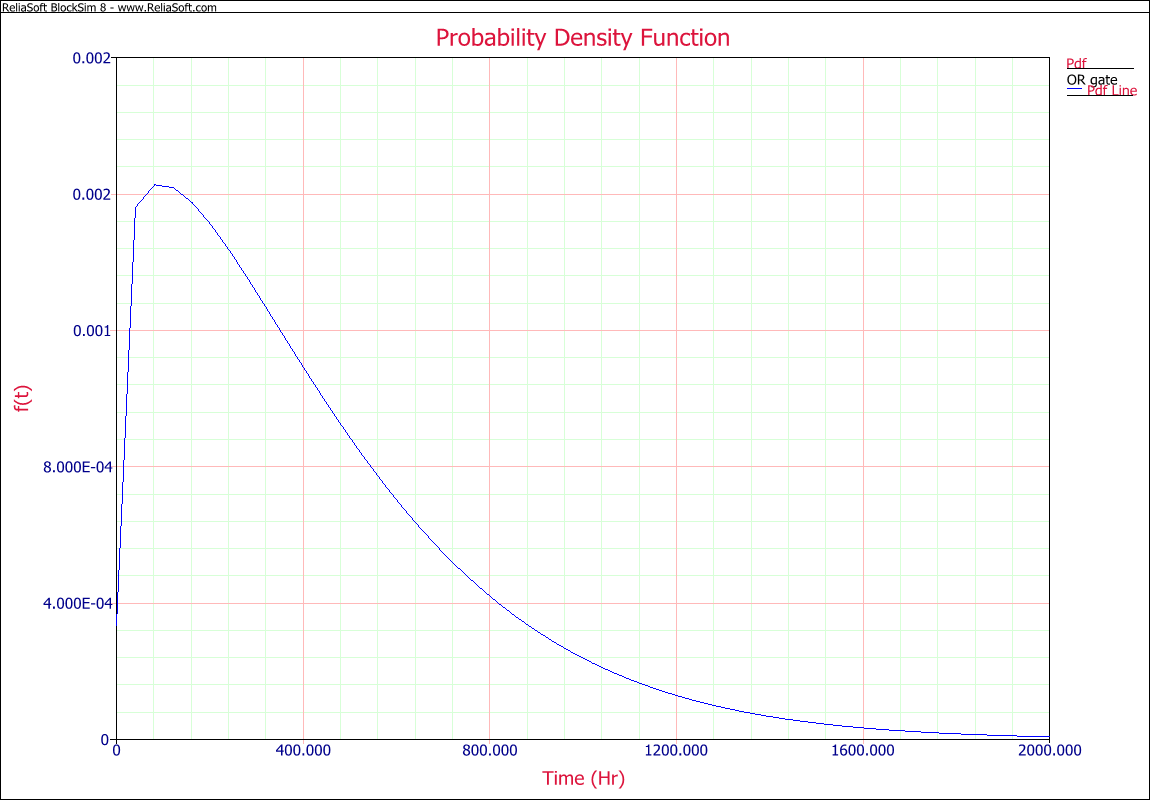
| 20:31, 8 March 2012 | PDF.png (file) |  |
67 KB | 1 | |
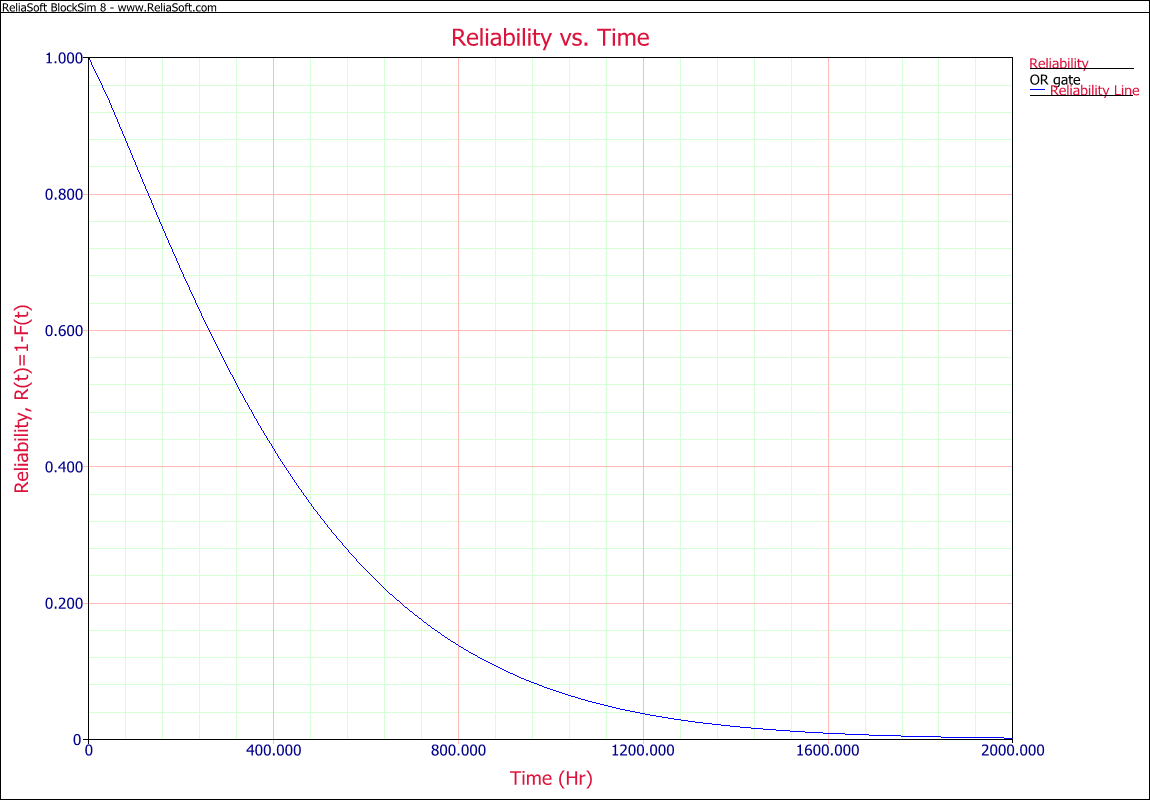
| 20:30, 8 March 2012 | Reliability VS Time.png (file) |  |
60 KB | 1 | |
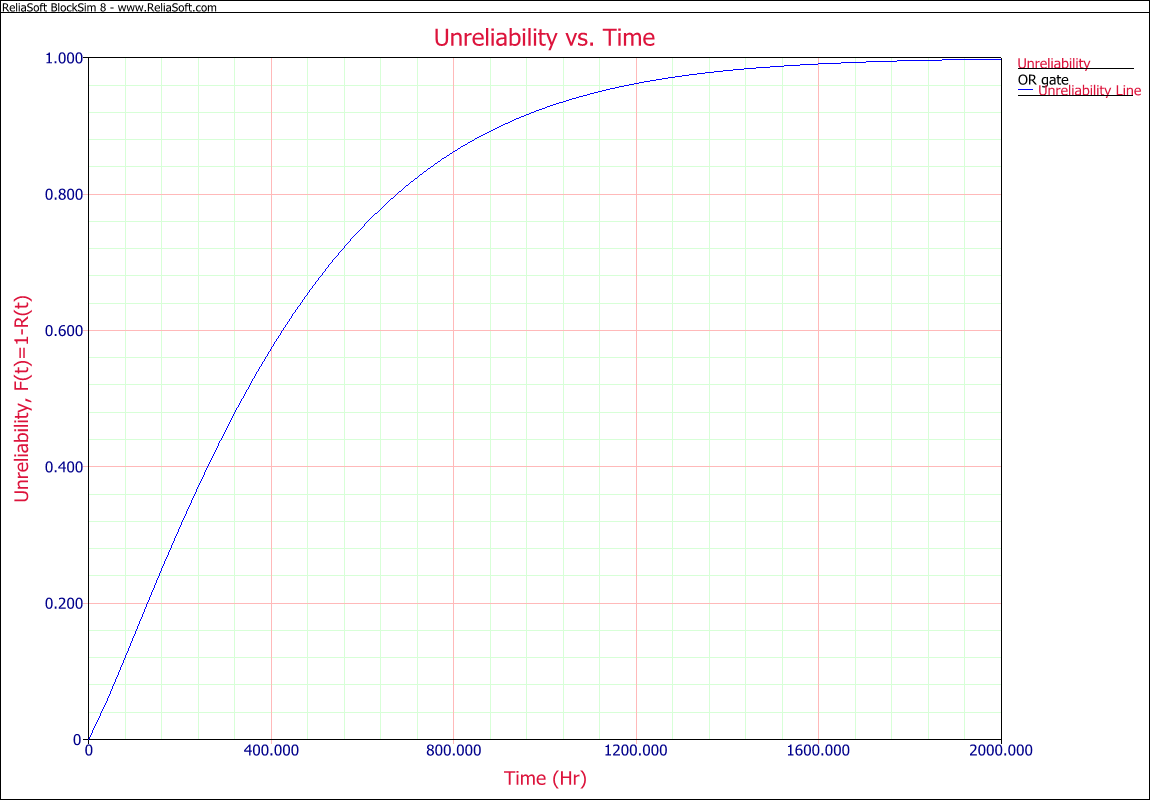
| 19:08, 8 March 2012 | Unreliability VS Time.png (file) |  |
67 KB | 1 | |
| 18:47, 8 March 2012 | OR gate Results.png (file) |  |
12 KB | 1 | |
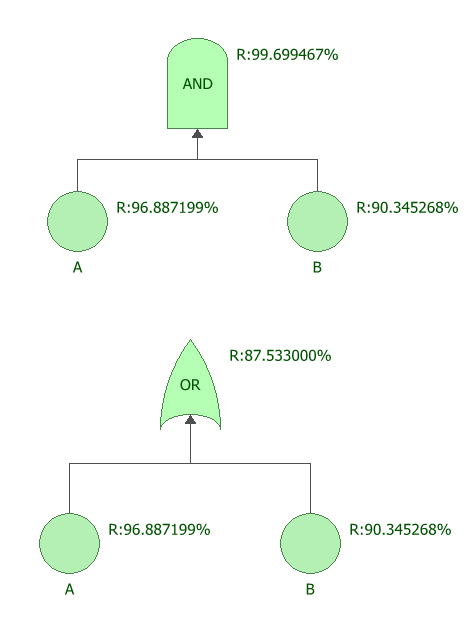
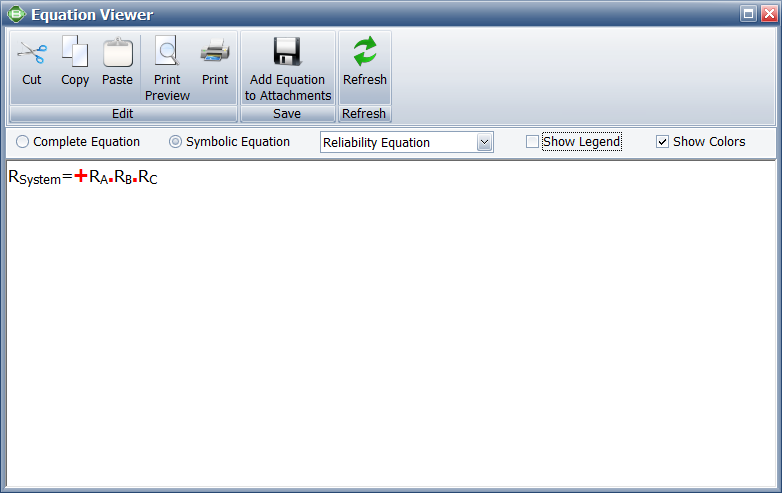
| 18:12, 8 March 2012 | AND gate.png (file) |  |
36 KB | 1 | |
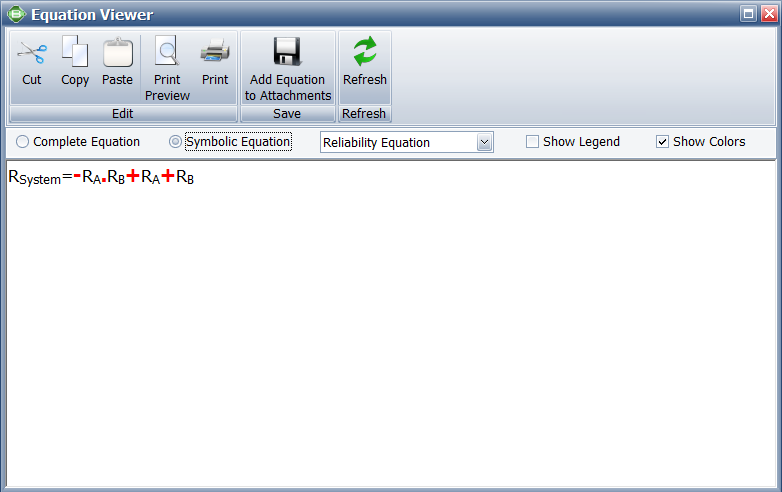
| 18:08, 8 March 2012 | OR gate.png (file) |  |
32 KB | 1 | |
| 15:46, 6 March 2012 | Fig 5.23 2.PNG (file) |  |
49 KB | 2 | |
| 23:19, 28 February 2012 | 8.14.gif (file) |  |
256 KB | 1 | |
| 22:14, 28 February 2012 | BS6.18.png (file) |  |
39 KB | 1 | |
| 17:48, 14 February 2012 | R32.png (file) |  |
87 KB | 1 | |
| 18:44, 10 February 2012 | BS8.23.png (file) |  |
83 KB | 2 | |
| 18:14, 10 February 2012 | BS8.19.png (file) |  |
81 KB | 1 | |
| 18:03, 10 February 2012 | BS8.18.png (file) |  |
72 KB | 1 | |
| 17:39, 10 February 2012 | 8.16.gif (file) |  |
90 KB | 1 | |
| 17:36, 10 February 2012 | 8.15.gif (file) |  |
129 KB | 2 |