Logistic Confidence Bounds Example: Difference between revisions
Jump to navigation
Jump to search
Kate Racaza (talk | contribs) (Created page with '<noinclude>{{Banner RGA Examples}} ''This example appears in the Reliability Growth and Repairable System Analysis Reference book''. </noinclude> For the data given…') |
Chris Kahn (talk | contribs) No edit summary |
||
| Line 5: | Line 5: | ||
For the data given <noinclude>in the [[Reliability Data - Logistic Model]] example</noinclude><includeonly>above for the reliability data example</includeonly>, calculate the 2-sided 90% confidence bounds under the Logistic model for the following: | For the data given <noinclude>in the [[Reliability Data - Logistic Model]] example</noinclude><includeonly>above for the reliability data example</includeonly>, calculate the 2-sided 90% confidence bounds under the Logistic model for the following: | ||
#The parameters <math>b\,\!</math> and <math>k\,\!</math>. | |||
#Reliability at month 5. | |||
'''Solution''' | '''Solution''' | ||
<ol> | |||
<li>The values of <math>\hat{b}\,\!</math> and <math>\hat{k}\,\!</math> that were estimated from the least squares analysis in the reliability data example are: | |||
::<math>\begin{align} | ::<math>\begin{align} | ||
| Line 35: | Line 34: | ||
\end{align}\,\!</math> | \end{align}\,\!</math> | ||
</li> | |||
<li>First, calculate the reliability estimation at month 5: | |||
::<math>\begin{align} | ::<math>\begin{align} | ||
| Line 44: | Line 43: | ||
:Thus, the 2-sided 90% confidence bounds on reliability at month 5 | :Thus, the 2-sided 90% confidence bounds on reliability at month 5 are: | ||
::<math>\begin{align} | ::<math>\begin{align} | ||
| Line 55: | Line 54: | ||
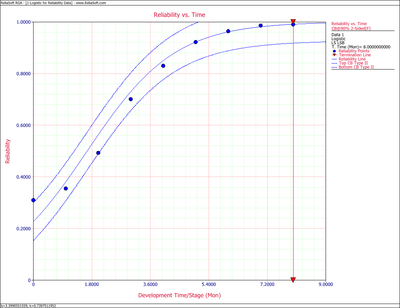
[[Image:rga8.6.png|center|400px|Logistic Reliability vs. Time plot with 2-sided 90% confidence bounds.]] | [[Image:rga8.6.png|center|400px|Logistic Reliability vs. Time plot with 2-sided 90% confidence bounds.]] | ||
</li> | |||
</ol> | |||
Revision as of 20:36, 15 May 2014
 |
New format available! This reference is now available in a new format that offers faster page load, improved display for calculations and images and more targeted search.
As of January 2024, this Reliawiki page will not continue to be updated. Please update all links and bookmarks to the latest references at RGA examples and RGA reference examples.
This example appears in the Reliability Growth and Repairable System Analysis Reference book.
For the data given in the Reliability Data - Logistic Model example, calculate the 2-sided 90% confidence bounds under the Logistic model for the following:
- The parameters [math]\displaystyle{ b\,\! }[/math] and [math]\displaystyle{ k\,\! }[/math].
- Reliability at month 5.
Solution
- The values of [math]\displaystyle{ \hat{b}\,\! }[/math] and [math]\displaystyle{ \hat{k}\,\! }[/math] that were estimated from the least squares analysis in the reliability data example are:
- [math]\displaystyle{ \begin{align} \widehat{b}= & 3.3991 \\ \widehat{\alpha }= & 0.7398 \end{align}\,\! }[/math]
- Thus, the 2-sided 90% confidence bounds on parameter [math]\displaystyle{ b\,\! }[/math] are:
- [math]\displaystyle{ \begin{align} {{b}_{lower}}= & 2.5547 \\ {{b}_{upper}}= & 4.5225 \end{align}\,\! }[/math]
- The 2-sided 90% confidence bounds on parameter [math]\displaystyle{ k\,\! }[/math] are:
- [math]\displaystyle{ \begin{align} {{k}_{lower}}= & 0.6798 \\ {{k}_{upper}}= & 0.7997 \end{align}\,\! }[/math]
- First, calculate the reliability estimation at month 5:
- [math]\displaystyle{ \begin{align} {{R}_{5}}= & \frac{1}{1+b{{e}^{-5k}}} \\ = & 0.9224 \end{align}\,\! }[/math]
- Thus, the 2-sided 90% confidence bounds on reliability at month 5 are:
- [math]\displaystyle{ \begin{align} {{[{{R}_{5}}]}_{lower}}= & 0.8493 \\ {{[{{R}_{5}}]}_{upper}}= & 0.9955 \end{align}\,\! }[/math]