Operational Testing Example
 |
New format available! This reference is now available in a new format that offers faster page load, improved display for calculations and images and more targeted search.
As of January 2024, this Reliawiki page will not continue to be updated. Please update all links and bookmarks to the latest references at RGA examples and RGA reference examples.
This example appears in the Reliability Growth and Repairable System Analysis Reference.
Consider two systems are placed into operational testing. The data for each system is given below. Do the following:
- After estimating the parameters, verify the assumption of [math]\displaystyle{ \beta = 1\,\! }[/math].
- Estimate the demonstrated MTBF of the system.
- What are the projected MTBF and growth potential MTBF of the system if the delayed fixes are to be implemented?
| System # | 1 | 2 |
| Start Time (Hr) | 0 | 0 |
| End Time (Hr) | 504 | 541 |
| Failure Times (Hr) | 21 BD43 | 83 BD37 |
| 29 A42 | 83 BD43 | |
| 43 BD10 | 83 BD46 | |
| 43 BD11 | 169 A45 | |
| 43 A39 | 213 A18 | |
| 66 A20 | 299 A42 | |
| 115 BD34 | 375 A1 | |
| 159 BD49 | 431 BD16 | |
| 199 BD47 | ||
| 202 BD47 | ||
| 222 BD47 | ||
| 248 BD14 | ||
| 248 BD15 | ||
| 255 BD41 | ||
| 286 BD40 | ||
| 286 BD48 | ||
| 304 BD47 | ||
| 320 BD13 | ||
| 348 BD11 | ||
| 364 BD44 | ||
| 404 BD44 | ||
| 410 BD4 | ||
| 429 BD47 |
The BD modes are implemented at the end of the test and assume a fixed effectiveness factor equal to 0.6.
Solution
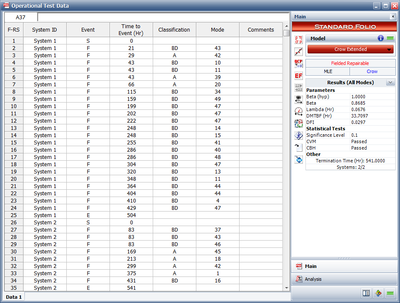
- The entered operational testing data and the estimated parameters are given below.
The assumption of [math]\displaystyle{ \beta = 1\,\! }[/math] can be checked by looking at the confidence bounds on [math]\displaystyle{ \beta\,\! }[/math] via the Quick Calculation Pad (QCP). The 90% 2-sided Crow confidence bounds on [math]\displaystyle{ \beta\,\! }[/math] are shown next.
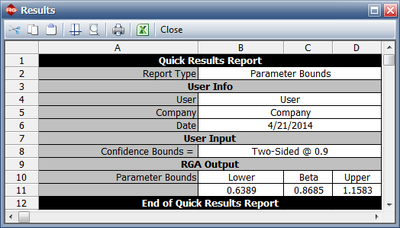
Since the confidence bounds on [math]\displaystyle{ \beta\,\! }[/math] include one, then you can fail to reject the hypothesis that [math]\displaystyle{ \beta = 1\,\! }[/math].
- From #1, the demonstrated MTBF (DMTBF) equals 33.7097 Hr.
- The projected MTBF and growth potential values can be displayed via the Growth Potential MTBF plot.
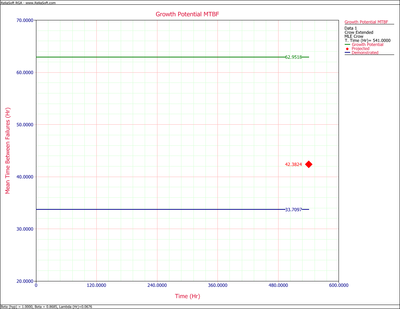
From the plot the projected MTBF equals 42.3824 Hr. The growth potential MTBF equals 62.9518 Hr.


