Constant Throughput Example
 |
New format available! This reference is now available in a new format that offers faster page load, improved display for calculations and images and more targeted search.
As of January 2024, this Reliawiki page will not continue to be updated. Please update all links and bookmarks to the latest references at BlockSim examples and BlockSim reference examples.
This example appears in the System analysis reference.
To examine throughput in phases, consider a phase diagram of three phases with linked RBDs, as shown in the figure below. Each phase has a duration of 10 hours and all phases are set to continue simulation upon failure. Blocks A through E process a number of items per hour as identified next to each letter (e.g., A:10 implies that 10 units are processed per hour by block A). Similarly, each phase is marked with the constant throughput sent to the blocks in the phase (e.g., P1:5 implies phase P1 sends 5 units to its blocks ). For the sake of simplicity, it is assumed that the blocks can never fail and that items are routed equally to each path (see Throughput Analysis Options). The ignore backlog option is left unchecked for all blocks in the phase diagram.
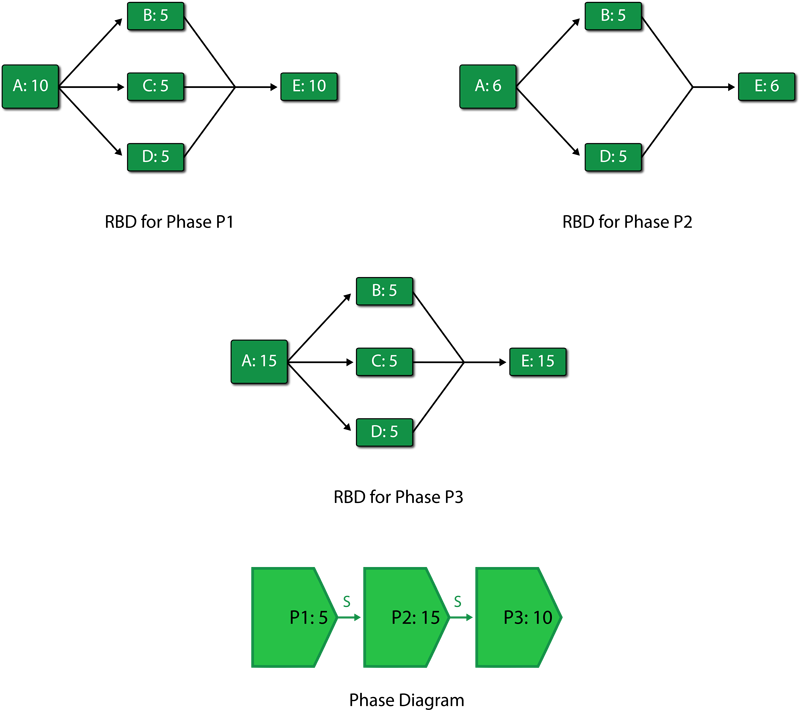
If the phase diagram is run on a throughput simulation with an end time of 60 hours, the following scenario can be observed:
- 1. Phase P1 from 0 to 10 hours
- a) Phase P1 sends 5 units in the first hour to block A. The capacity of block A in this phase is 10 units per hour. Block A processes these 5 units with an excess capacity of 5 units in the first hour.
- b) The 5 units processed by block A are routed equally over the three paths to blocks B, C and D. Each of these blocks receives 1.67 units in the first hour. The capacity of each of these blocks is 5 units per hour. Thus, blocks B, C and D each process 1.67 units with an excess capacity of 3.33 units in the first hour.
- c) Blocks B, C and D route each of their 1.67 units to E. The capacity of E in this phase is 10 units per hour. E processes the total of 5 units with an excess capacity of 5 units in the first hour.
- d) The above steps are repeated for the first ten hours to complete phase P1.
- 1. Phase P1 from 0 to 10 hours
- A summary result table for phase P1 is shown next.
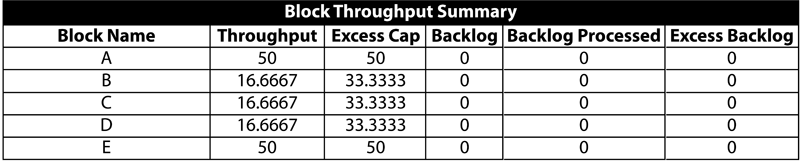
- 2. Phase P2 from 10 to 20 hours
- a) Phase P2 sends 15 units in its first hour to block A. The capacity of block A in this phase is changed from the previous phase and is now 6 units per hour. Thus, block A is able to process only 6 units while there is a backlog of 9 units per hour.
- b) The 6 units processed by block A are routed equally to blocks B and D as C is absent in this phase. Blocks B and D get 3 units each. The capacity of each of these blocks is 5 units per hour. Thus, blocks B and D process 3 units with an excess capacity of 2 units each in the first hour of the second phase.
- c) Blocks B and D route a total of 6 units to E. The capacity of block E in this phase is 6 units per hour. Thus, block E processes 6 units in the first hour of phase 2 with no excess capacity and no backlog.
- d) The above steps are repeated for the ten hours of phase P2. At 20 hours phase P2 ends.
- 2. Phase P2 from 10 to 20 hours
- A summary result table for phase P2 is shown next.

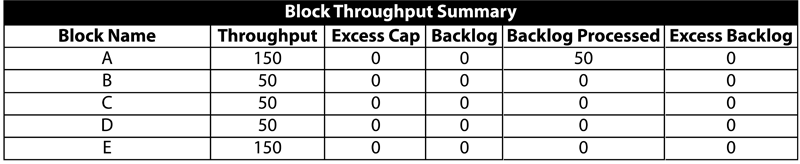
- 3. Phase P3 from 20 to 30 hours
- a) Phase P3 sends 10 units in its first hour to block A. The capacity of block A in this phase is now 15 units per hour. Thus, block A is able to process all 10 units sent by P3 and also process 5 units of the backlog from phase P2. Thus, during the first hour of phase P3, block A processes 15 units that includes a backlog of 5 units. Since block A is used to its full capacity, the excess capacity of A is zero.
- b) The 15 units processed by block A in the first hour are routed equally over three paths to blocks B, C and D as block C is available again in this phase. Blocks B, C and D receive 5 units each. The capacity of each of these block is 5 units per hour. Thus, blocks B, C and D process 5 units each to full capacity with no excess capacity during the first hour of the third phase.
- c) Blocks B, C and D route each of their 5 units to E. The capacity of block E in this phase is 15 units per hour. Thus, block E processes 15 units in the first hour of phase P3 with no excess capacity and no backlog.
- d) The above steps are repeated for the ten hours of phase P3. It should be noted that although some of the backlog from phase P2 gets processed in phase P3 [math]\displaystyle{ (5\times 10=50\,\! }[/math] units from the backlog get processed ), not all 90 backlogged units are processed ( [math]\displaystyle{ 90-50 = 40\,\! }[/math] units remain). The remaining units cannot be shown as backlog for phase P3 because these were generated in phase P2. To avoid confusion between backlogs of different phases, BlockSim does not display backlog values at the individual phase levels. At 30 hours, phase P3 ends. This also ends the first cycle of the phase diagram.
- 3. Phase P3 from 20 to 30 hours
- A summary result table for phase P3 is shown next.
- A summary result table for phase P3 is shown next.
- 4. Phase P1 in the second cycle from 30 to 40 hours
- a) As in the first cycle, phase P1 sends 5 units to block A in the first hour. The capacity of block A in this phase is 10 units per hour. Thus, block A is able to process all 5 units sent by P1 and also process 5 units of the backlog from the first cycle. Thus, during the first hour of the second cycle of phase P1, block A processes 10 units that includes a backlog of 5 units. Since there is a backlog of 40 units from the first cycle, this is processed by block A in the first eight hours of the second cycle. During the last two hours of the second cycle of phase P1, block A processes only the 5 units per hour it receives from P1 and has an excess capacity of 5 units per hour. Thus, by the end of this phase, block A processes a total of 90 units (i.e., 50 units from P1 and 40 units of backlog) with an excess capacity of 10 units.
- b) Units processed by block A are routed equally to blocks B, C and D. During the first eight hours of the second cycle of phase P1, 10 units per hour are sent by block A to blocks B, C and D. Each of these blocks gets 3.33 units per hour. The capacity of each of these blocks is 5 units per hour. Thus, during the first eight hours of P1 in the second cycle, blocks B, C and D process 3.33 units per hour with an excess capacity of 1.67 units per hour. During the last two hours, block A processes 5 units per hour. Thus, blocks B, C and D process 1.67 units per hour with an excess capacity of 3.33 units per hour. At the end of the phase, blocks B, C and D each process a total of 30 units [math]\displaystyle{ (3.33\times 8+1.67\times 2=30)\,\! }[/math] with an excess capacity of 20 units [math]\displaystyle{ (1.67\times 8+3.33\times 2=20)\,\! }[/math].
- c) Blocks B, C and D route each of their units to block E. The capacity of E in this phase is 10 units per hour. Block E processes 10 units per hour with no excess capacity during the first eight hours of the phase. During the last two hours, block E processes 5 units per hour with an excess capacity of 5 units per hour. By the end of the phase, block E processes a total of 90 units with an excess capacity of 10 units.
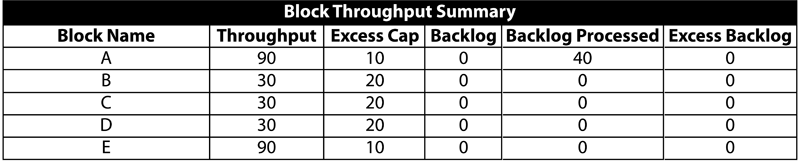
- 4. Phase P1 in the second cycle from 30 to 40 hours
- A summary result table for the second cycle of phase P1 is shown next.
- 5. Phase P2 in the second cycle from 40 to 50 hours
- a) As in the first cycle, phase P2 sends 15 units in its first hour to block A. The capacity of block A in this phase is 6 units per hour. Thus, block A processes only 6 units while there is a backlog of 9 units per hour.
- b) The 6 units processed by block A are routed equally to blocks B and D, as C is absent in this phase. Blocks B and D receive 3 units each. The capacity of each of these blocks is 5 units per hour. Thus, in the second cycle, blocks B and D process 3 units each with an excess capacity of 2 units each in the first hour of the second phase.
- c) Blocks B and D route a total of 6 units to block E. The capacity of E in this phase is 6 units per hour. Thus, block E processes 6 units in the first hour of the phase with no excess capacity and no backlog.
- d) The above steps are repeated for the ten hours of phase P2. At 50 hours, phase P2 ends in the second cycle.
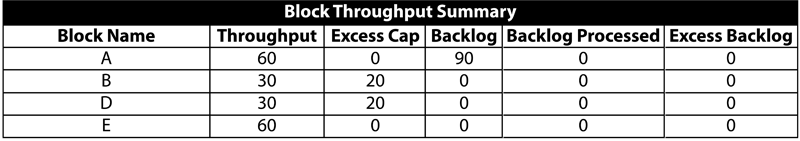
- 5. Phase P2 in the second cycle from 40 to 50 hours
- A summary result table for the second cycle of phase P2 is shown next.
- 6. Phase P3 in the second cycle from 50 to 60 hours
- a) Phase P3 sends 10 units in its first hour to block A in the second cycle. The capacity of block A in this phase is 15 units per hour. Thus, block A is able to process all 10 units sent by P3 and also process 5 units of backlog from the second cycle of phase P2. Thus, during the first hour of phase P3, block A processes 15 units that includes a backlog of 5 units. Since block A is used to its full capacity, the excess capacity of A is zero.
- b) The 15 units processed by block A in the first hour are routed equally over three paths to blocks B, C and D, as block C is available again in this phase. Blocks B, C and D receive 5 units each. The capacity of each of these block is 5 units per hour. Thus, blocks B, C and D process 5 units each to full capacity with no excess capacity during the first hour of the third phase.
- c) Blocks B, C and D route each of their 5 units to block E. The capacity of E in this phase is 15 units per hour. Thus, block E processes 15 units in the first hour of phase P3 with no excess capacity and no backlog.
- d) The above steps are repeated for the ten hours of phase P3. At 60 hours, phase P3 ends. This ends the second cycle of the phase diagram and also marks the end of the simulation.
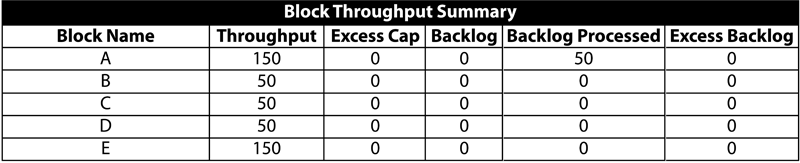
- 6. Phase P3 in the second cycle from 50 to 60 hours
- A summary result table for the second cycle of phase P3 is shown next.
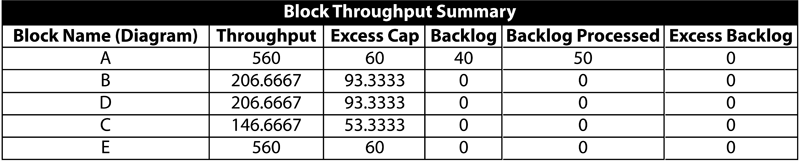
A summary result table for the overall system for the simulation from 0 to 60 hours is shown in the following table.